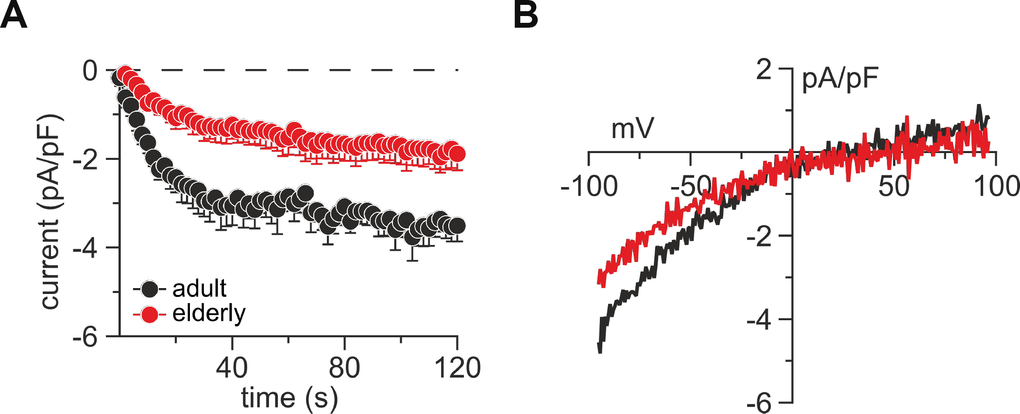
Figure 2.Untouched CD8+ T cells from elderly mice show reduced lP3-induced CRAC currents. (A) Average IP3-induced CRAC current amplitudes at –80 mV normalized to cell size from CD8+ T cells of adult (black, n = 8) and elderly (red, n = 7) mice. (B) Average current-voltage relationship of CRAC currents from cells presented in (A) after CRAC had fully developed. Data obtained are presented as mean ± SEM.