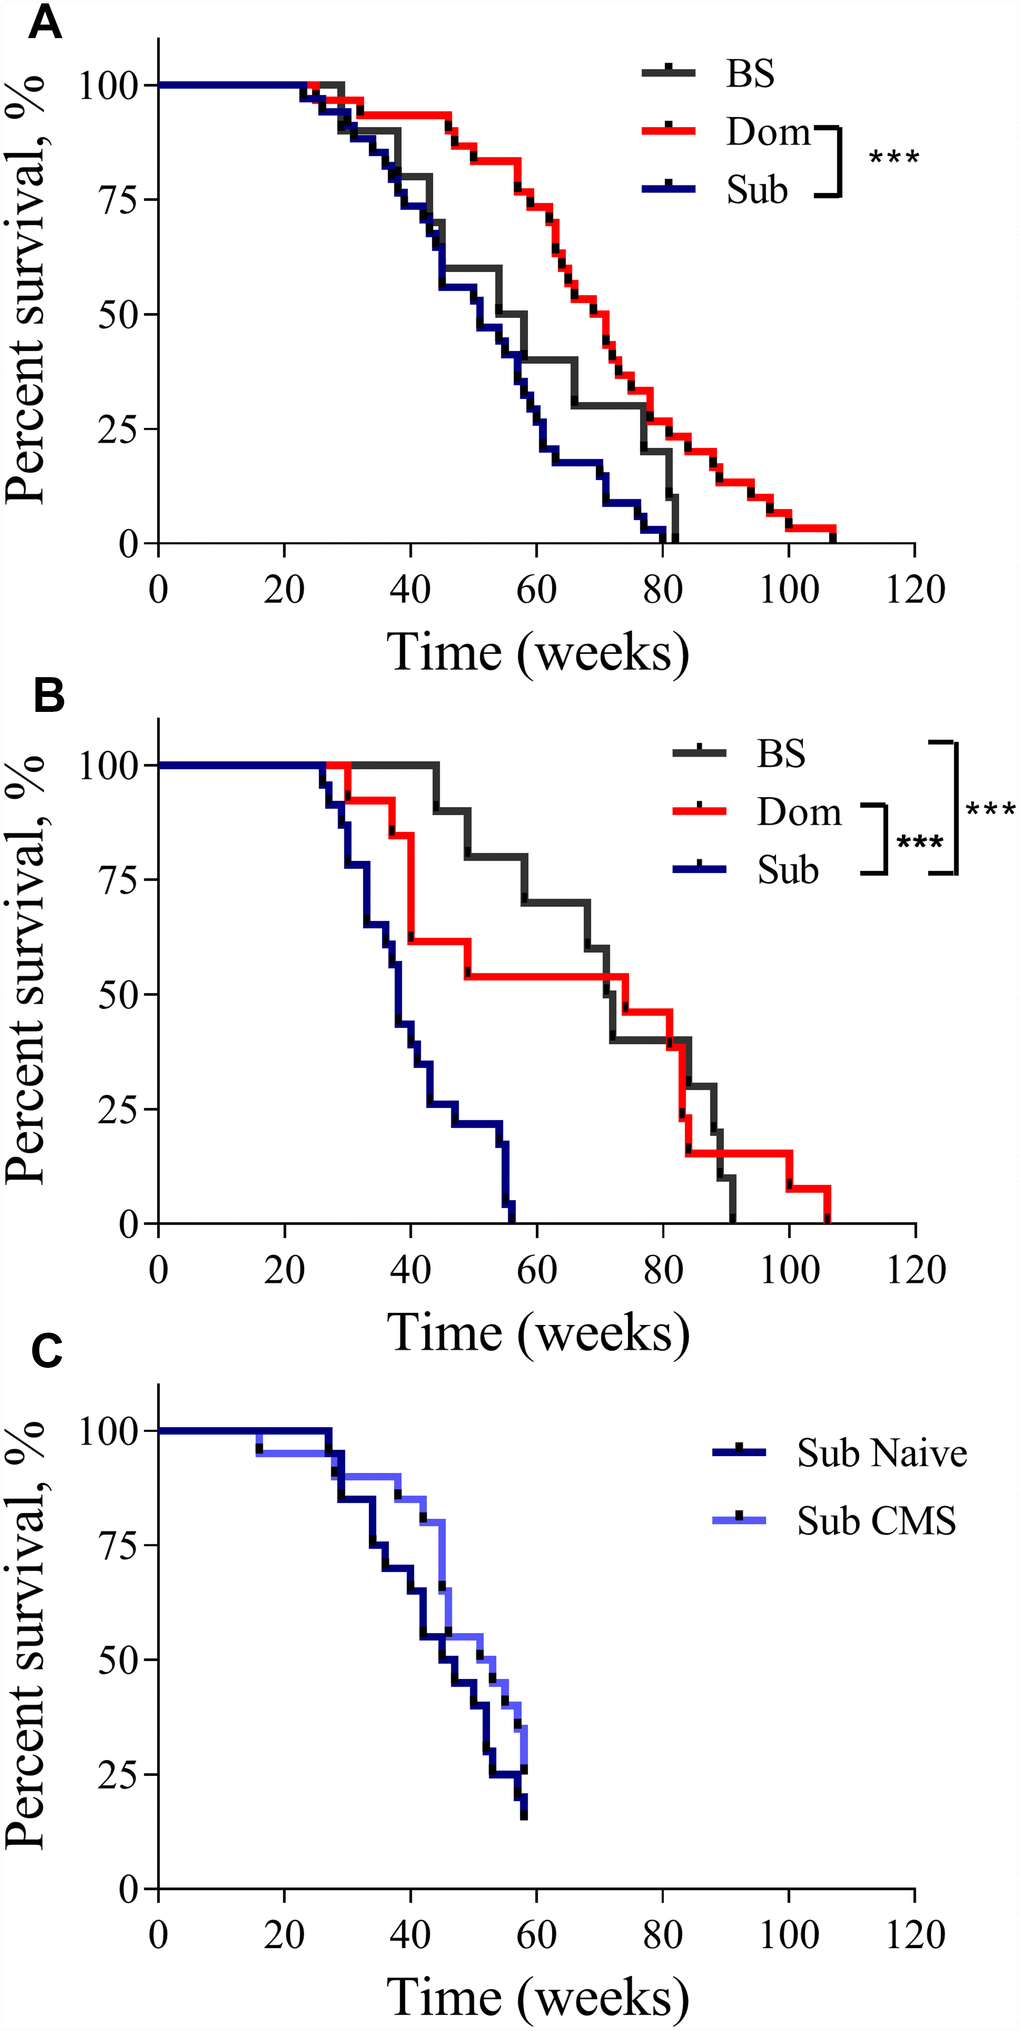
Figure 1.The lifespan of Dom, Sub and BS mice. The Kaplan-Meier survival curves of Dom, Sub and BS mice in (A) males (log-rank test, p<0.001;n=30 for Dom and n=34 for Sub, and n=10 for BS), and (B) females (log-rank test, p<0.05; n=13 for Dom and n=23 for Sub, and n=10 for BS), (C) Sub naïve (n=20) and exposed to CMS (n=20) males. * - p<0.05, *** - p<0.001.