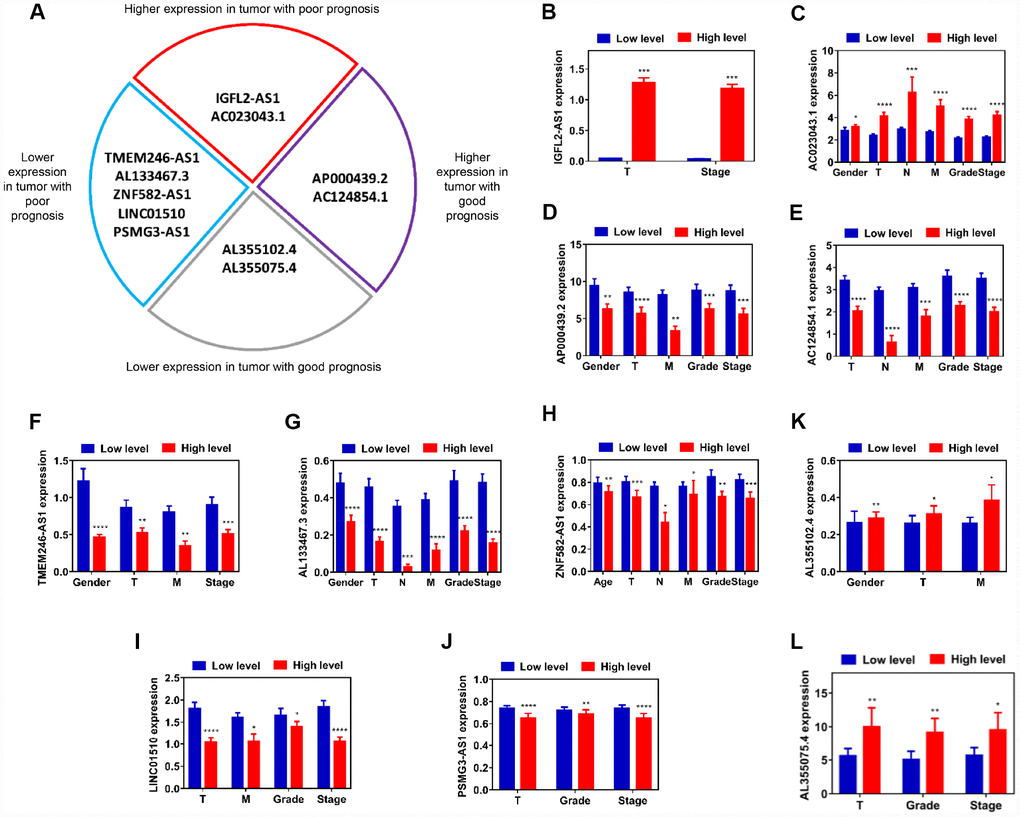
Figure 3.Assessment of correlation between candidate lncRNAs and clinicopathological characteristics. (A) Schematic diagram of four subgroups from 11 candidate lncRNAs. (B–L) Relative expression level comparison of each lncRNA in different characteristic subgroups (age, gender, T, N, M, grade and stage). *P<0.05, **P<0.01, ***P<0.001 and ****P<0.0001. lncRNAs, long non-coding RNAs.