Submit an Article
Navigate
Home
Editorial Board
Editorial Policies
Current Volume
Archive
Scientific Integrity
Publication Ethics Statements
Interviews with Outstanding Authors
Newsroom
Sponsored Conferences
Podcast
Contact
Special Collections
Submit an Article
Online ISSN: 1945-4589
Research Paper
|
Volume 11, Issue 21
|
pp. 9478–9491
Identifying hub genes of clear cell renal cell carcinoma associated with the proportion of regulatory T cells by weighted gene co-expression network analysis
Back to article
Figure 7
(7 of 7)
−
100%
+
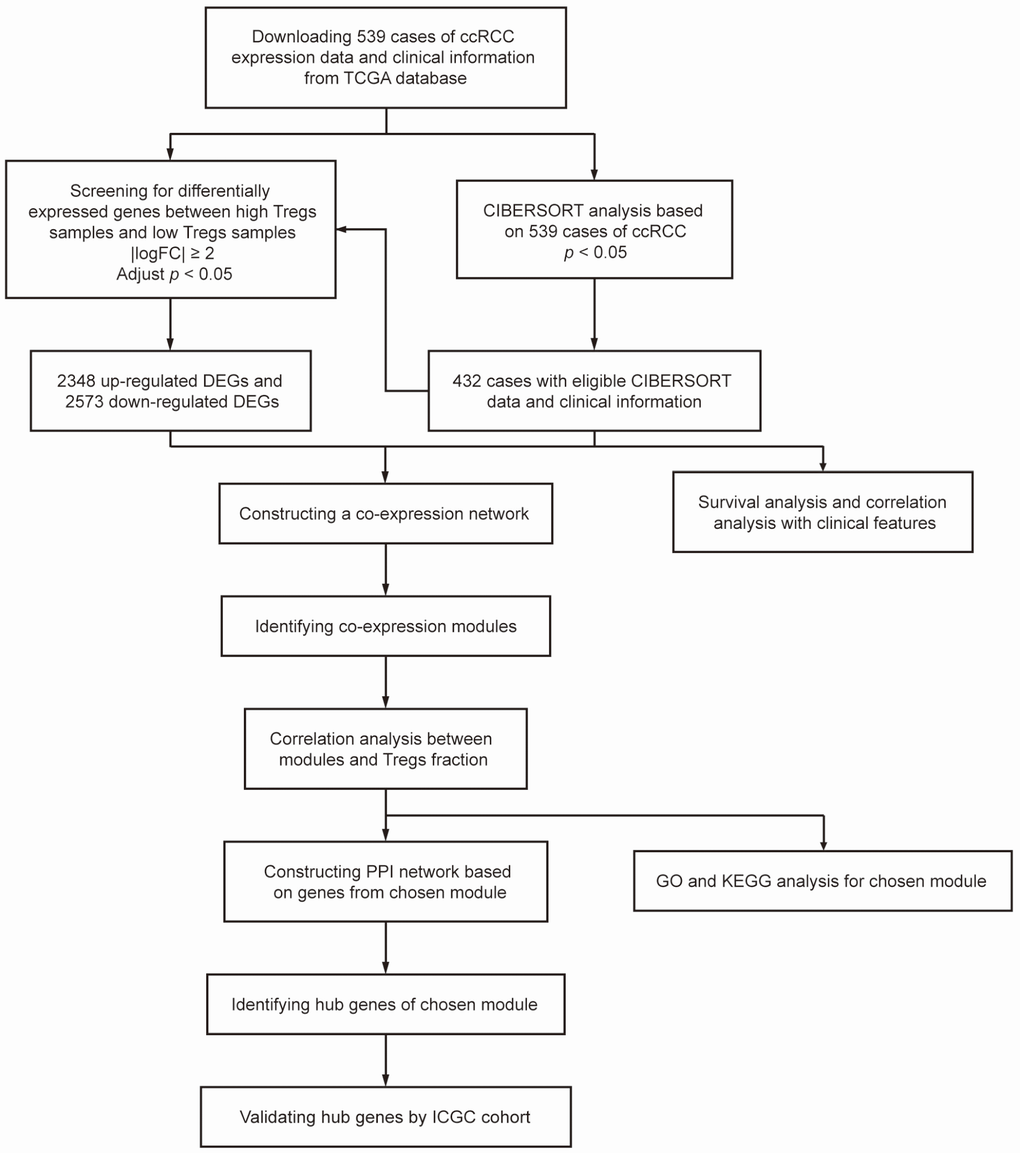
Figure 7.
Flowchart detailing the study design and samples at each stage of the analysis.