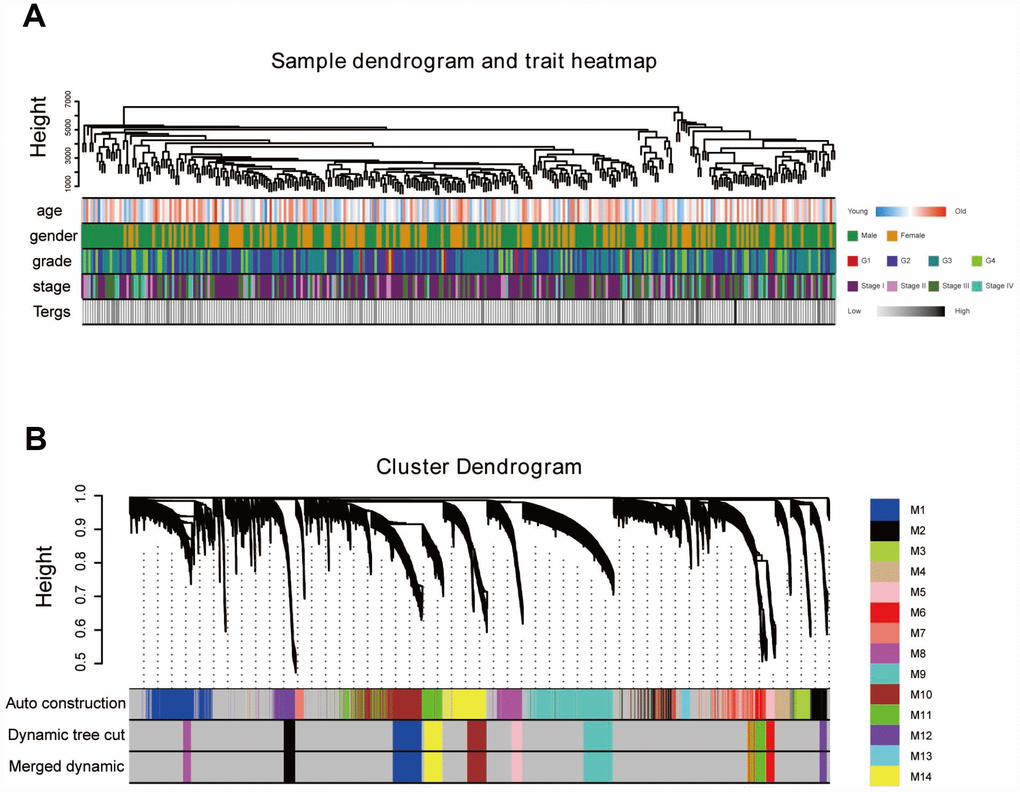
Figure 3.Sample dendrogram and clustering dendrogram of WGCNA. (A) Sample dendrogram and corresponding clinical characteristics. (B) Cluster dendrogram of 432 samples with eligible data.
Figure 3 — Identifying hub genes of clear cell renal cell carcinoma associated with the proportion of regulatory T cells by weighted gene co-expression network analysis | Aging