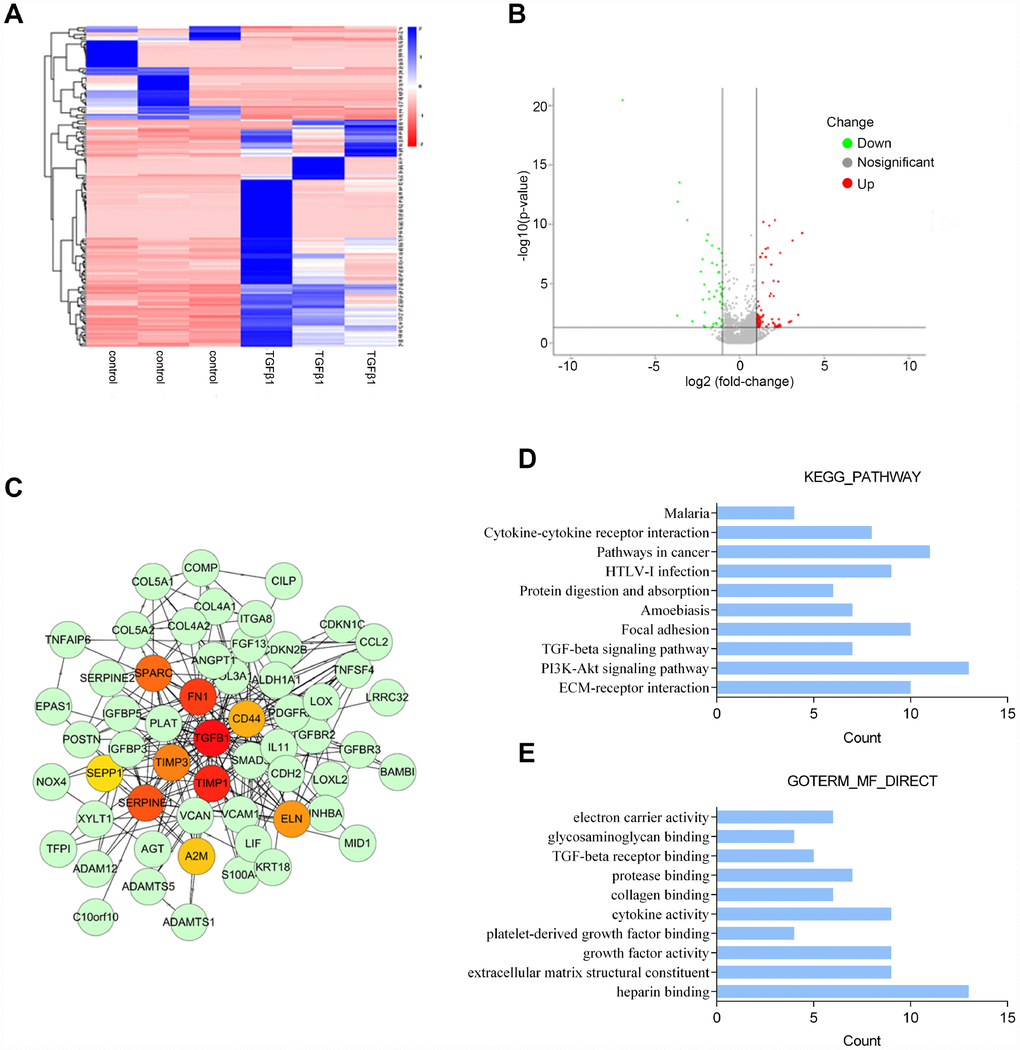
Figure 2.Microarray profile analysis of differentially-expressed genes in PrSCs induced by TGFβ1 analyzed by (A) Hierarchical clustering of gene expression in PrSCs with or without TGFβ1 treatment. (B) Volcano plot showing the differentially- expressed genes. (C) Network diagram of the interaction between upregulated and downregulated genes constructed by STRING analysis and visualized by Cytoscape. (D) KEGG pathway annotation of the differentially-expressed genes. (E) GO enrichment analyses of the differentially-expressed genes.