Submit an Article
Navigate
Home
Editorial Board
Editorial Policies
Current Volume
Archive
Scientific Integrity
Publication Ethics Statements
Interviews with Outstanding Authors
Newsroom
Sponsored Conferences
Podcast
Contact
Special Collections
Submit an Article
Online ISSN: 1945-4589
Research Paper
|
Volume 11, Issue 21
|
pp. 9405–9423
Systematic identification of lncRNA-based prognostic biomarkers for glioblastoma
Back to article
Figure 9
(9 of 11)
−
100%
+
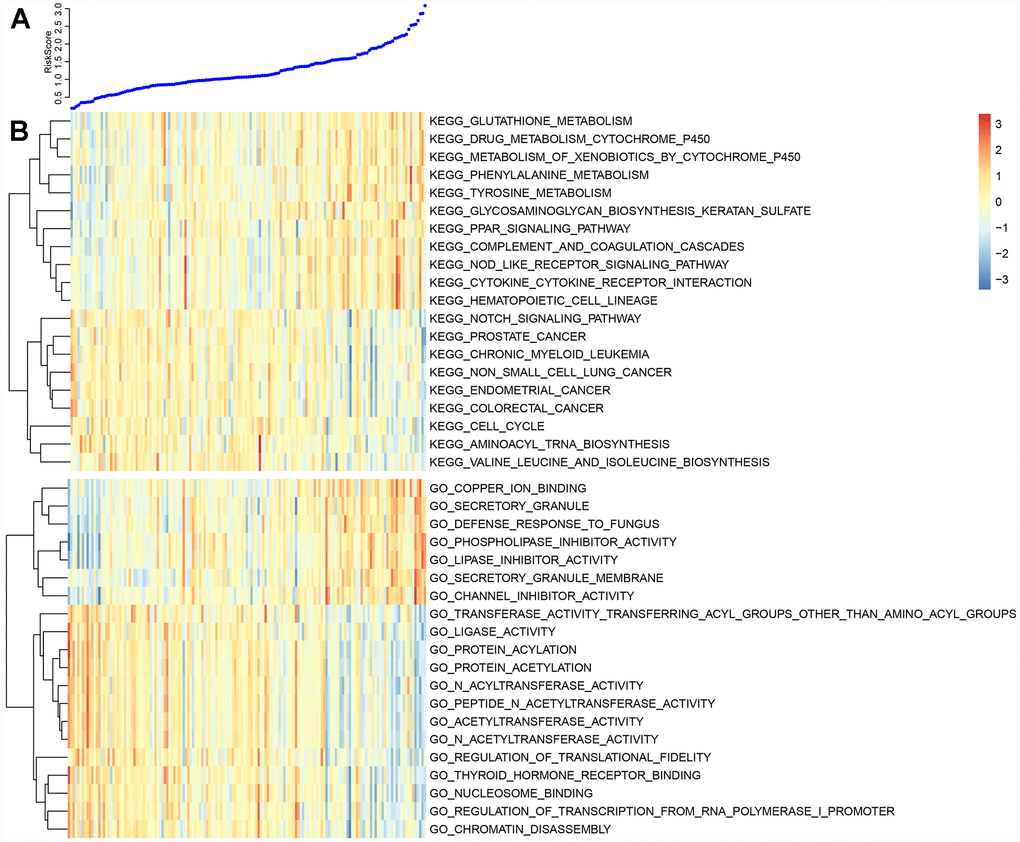
Figure 9.
(
A
) The top curve shows Risk Score distribution of GBM patients. (
B
) The heat map of Risk Score-related top 20 KEGG Pathway and top 20 GO Terms.