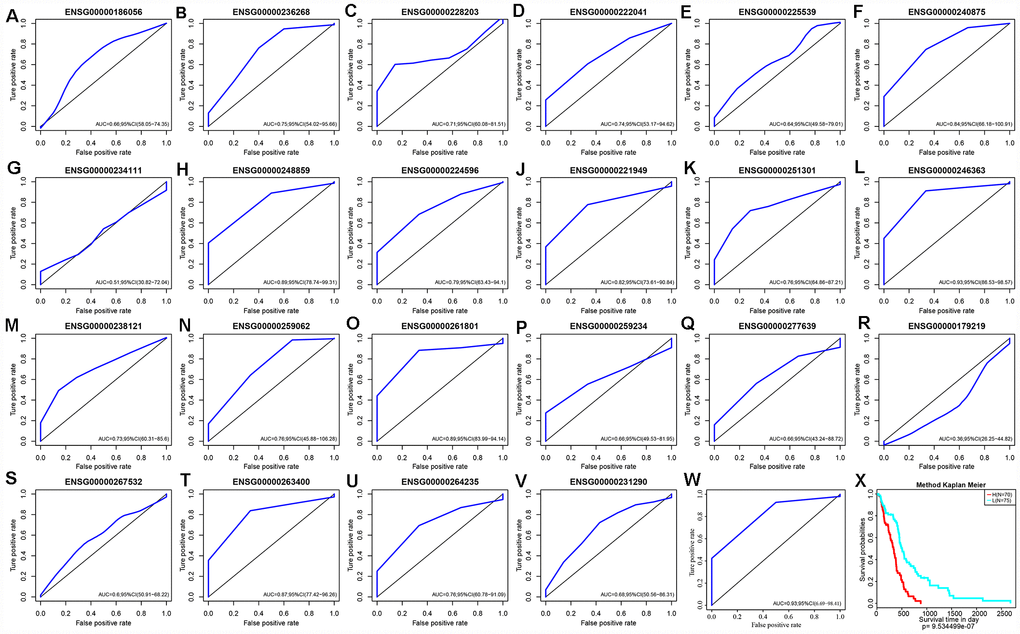
Figure 8.(A–V) ROC curves of 22 lncRNAs with significant prognostic value for GBM. (W) ROC curves of five-lncRNA model. (X) Patients of High-Risk and Low-Risk group. Survival analysis showed that the prognosis of the high-risk group was worse than that of the low-risk group, p < 0.01.