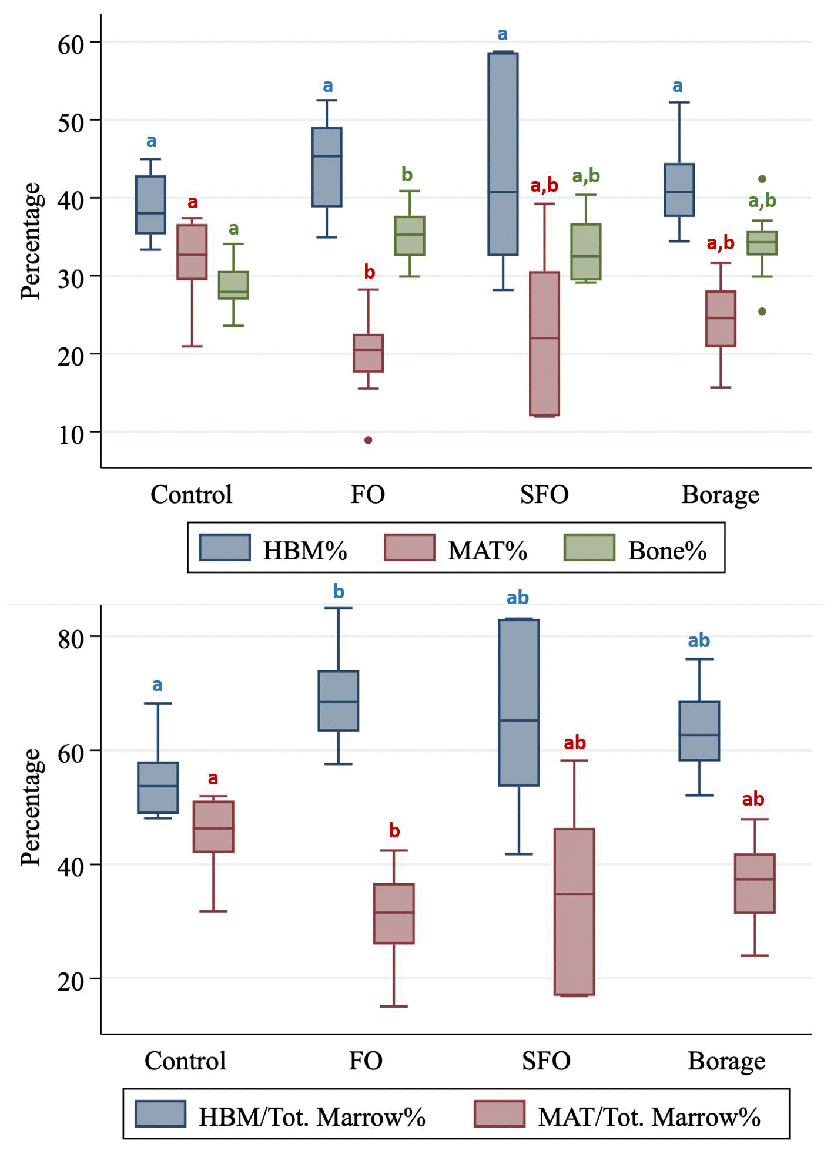
Figure 2.Hematopoietic bone marrow (HBM%), marrow adipose tissue (MAT%) and Bone (Bone%) volume fractions (Upper panel) and total marrow volume fractions of HBM and MAT compared between four nutritional groups (Control; fish oil [FO], sunflower oil [SFO] and borage oil groups). Groups with different letter markers are significantly different after adjusting for multiple comparisons (p<0.001).