Submit an Article
Navigate
Home
Editorial Board
Editorial Policies
Current Volume
Archive
Scientific Integrity
Publication Ethics Statements
Interviews with Outstanding Authors
Newsroom
Sponsored Conferences
Podcast
Contact
Special Collections
Submit an Article
Online ISSN: 1945-4589
Research Paper
|
Volume 11, Issue 18
|
pp. 7938–7947
The effects of dietary fatty acids on bone, hematopoietic marrow and marrow adipose tissue in a murine model of senile osteoporosis
Back to article
Figure 1
(1 of 3)
−
100%
+
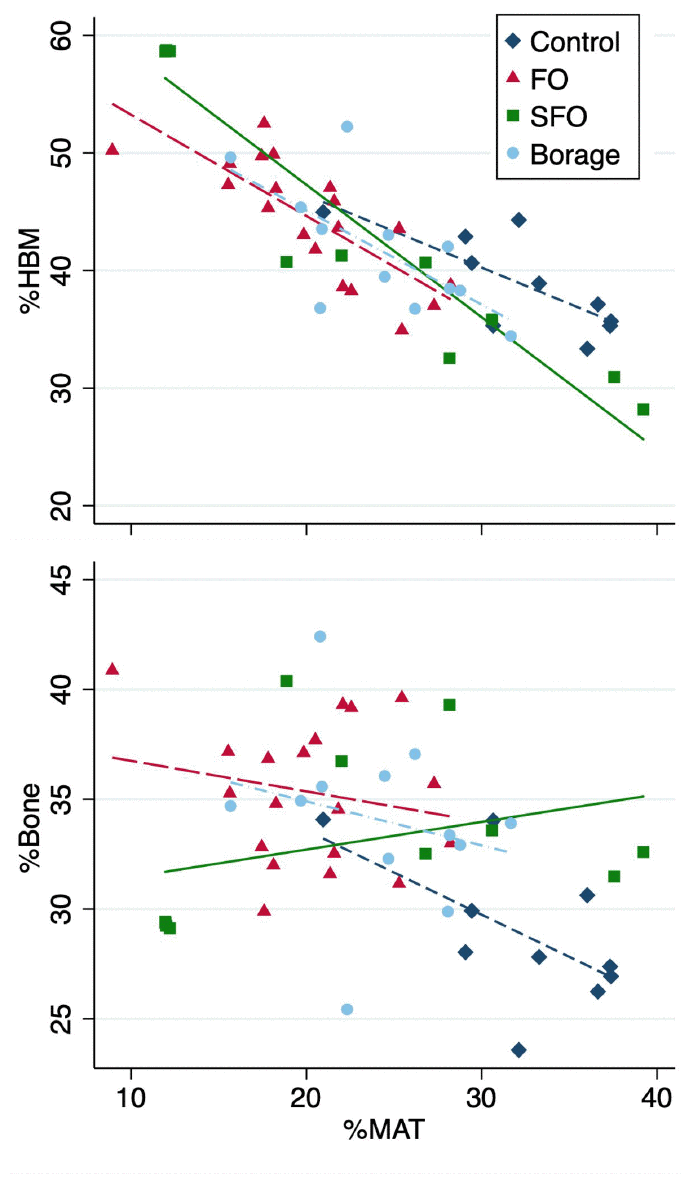
Figure 1.
Associations of total tissue volume percentages of marrow adipose tissue (%MAT) vs hematopoietic bone marrow (%HBM, upper panel) and %bone (lower panel) in the four test diet groups.