Submit an Article
Navigate
Home
Editorial Board
Editorial Policies
Current Volume
Archive
Scientific Integrity
Publication Ethics Statements
Interviews with Outstanding Authors
Newsroom
Sponsored Conferences
Podcast
Contact
Special Collections
Submit an Article
Online ISSN: 1945-4589
Research Paper
|
Volume 11, Issue 18
|
pp. 7899–7913
Fibroblast growth factor 23 expression in human calcified vascular tissues
Back to article
Figure 5
(5 of 5)
−
100%
+
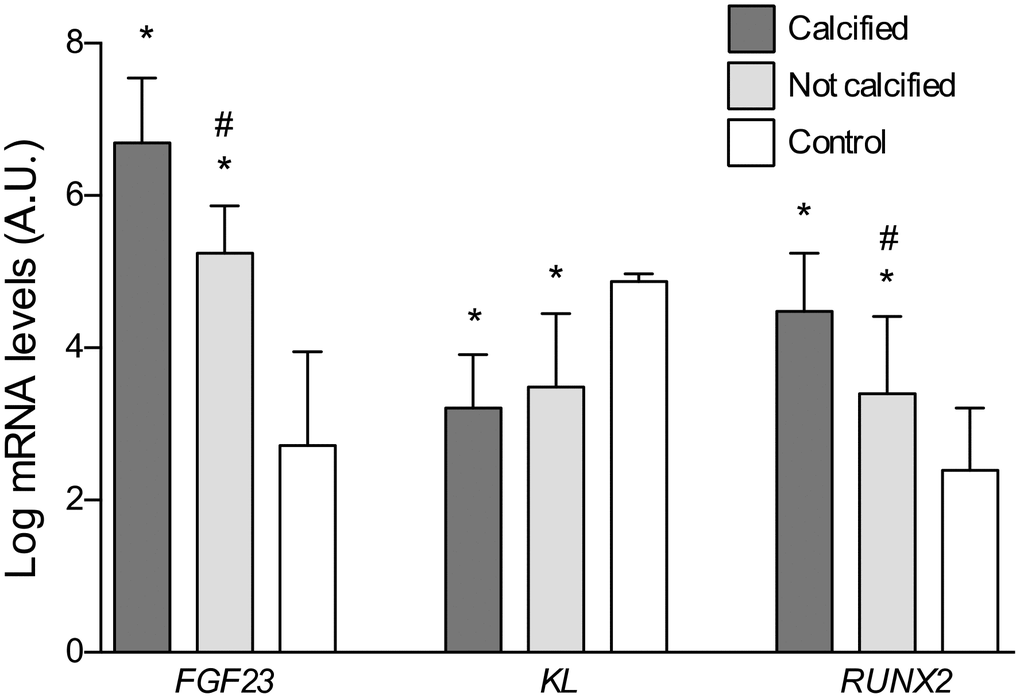
Figure 5.
Differences in the log-transformed gene expression levels of
FGF23, Klotho
, and
RUNX2
attending to the presence of calcification.
*P<0.01 vs. control group; #P<0.01 vs. calcified group.