Submit an Article
Navigate
Home
Editorial Board
Editorial Policies
Current Volume
Archive
Scientific Integrity
Publication Ethics Statements
Interviews with Outstanding Authors
Newsroom
Sponsored Conferences
Podcast
Contact
Special Collections
Submit an Article
Online ISSN: 1945-4589
Research Paper
|
Volume 11, Issue 18
|
pp. 7859–7879
Up regulation of Rho-associated coiled-coil containing kinase1 (ROCK1) is associated with genetic instability and poor prognosis in prostate cancer
Back to article
Figure 1
(1 of 4)
−
100%
+
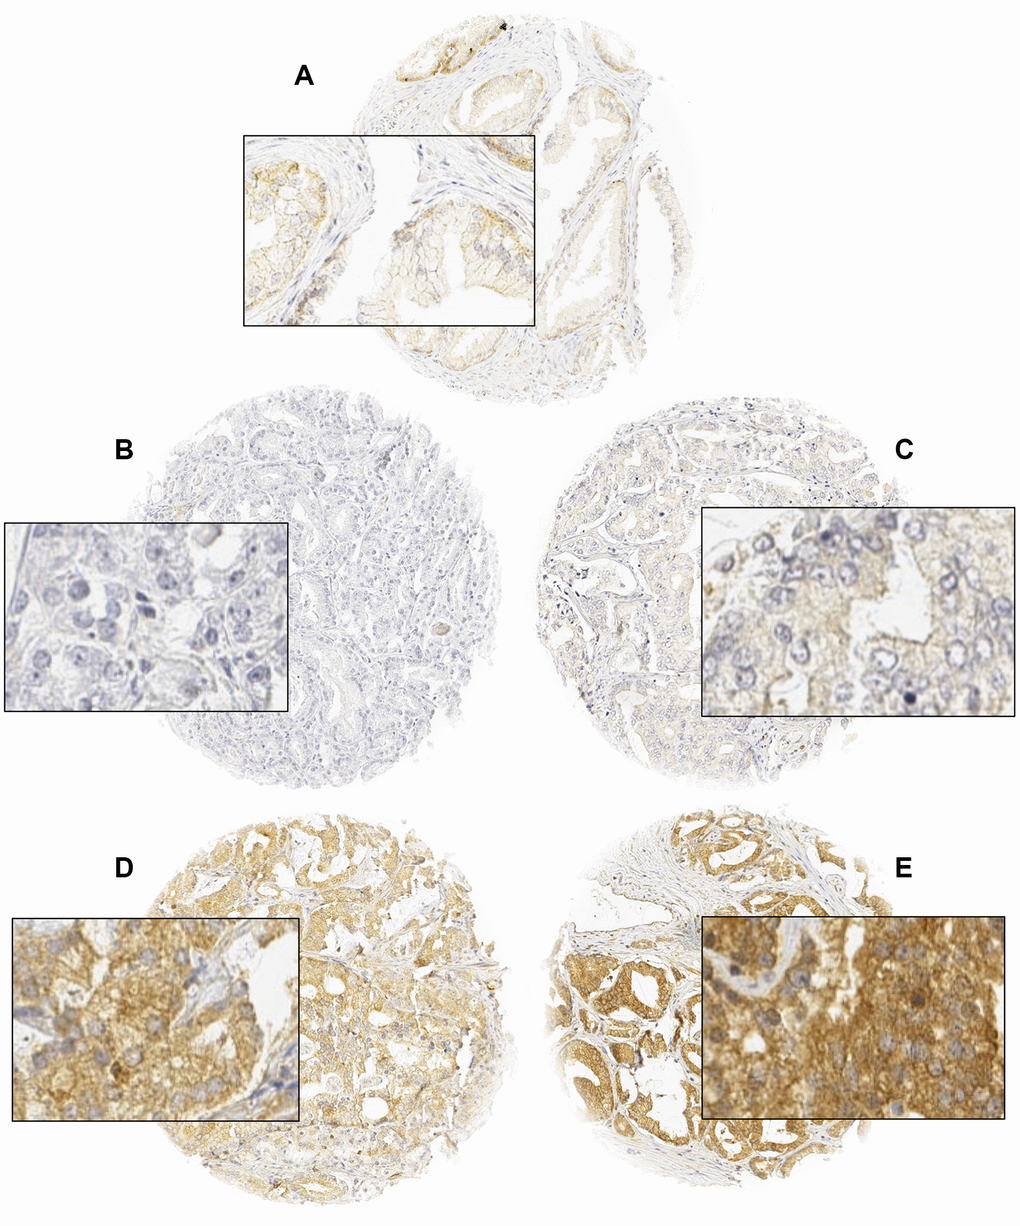
Figure 1.
Representative images of normal (
A
) and cancerous glands (
B
–
E
) with negative (
B
), weak (
C
), moderate (
D
), and strong (
E
) ROCK1 staining. Spot size is 600 μm at 100 / 400x of originals.