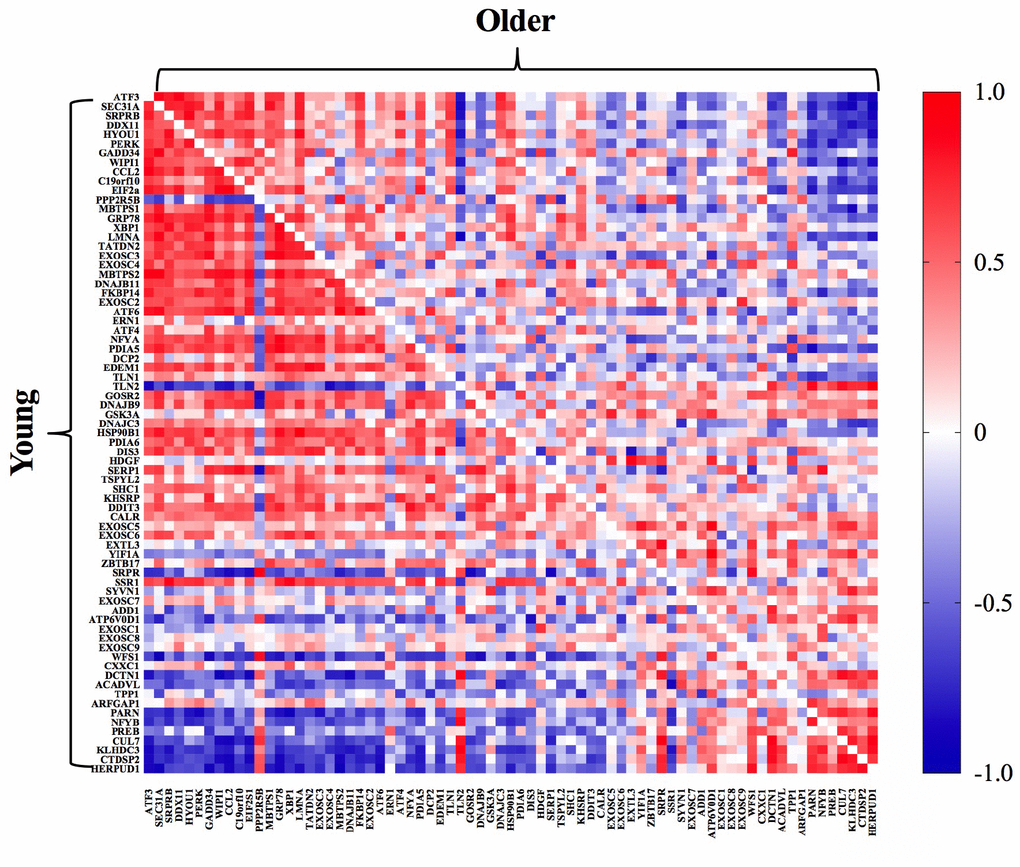
Figure 3.Pathway activation analysis demonstrated a stronger coordinated response of gene transcripts associated with the UPR post-exercise in young (bottom left) compared to older (upper right) adults. The correlation matrix heat maps demonstrate significant positive (dark red) and negative (dark blue) relationships between the fold-change from baseline to 18h post-exercise for the individual gene transcripts associated with the UPR pathway in young and older adults.