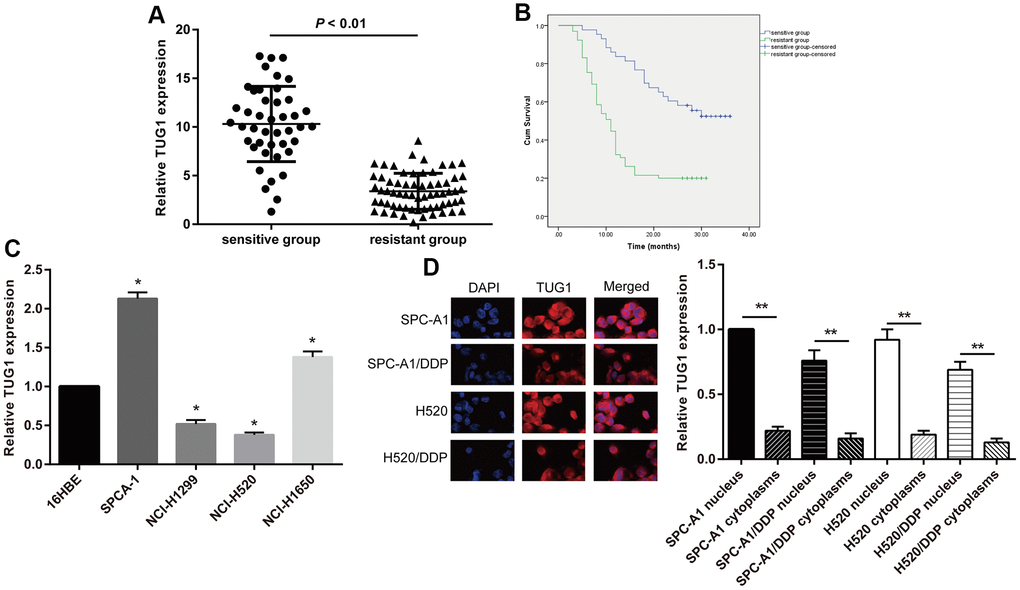
Figure 1.The TUG1 expression level and the intracellular localization. (A) The TUG1 expression level of NSCLC patients in the resistant and sensitive groups; (B) survival conditions of NSCLC patients in the resistant and sensitive groups; (C) expression level of TUG1 determined by qRT-PCR in NSCLC cells; (D) the intracellular localization by fluorescence in situ hybridization in NSCLC cells. ** p < 0.01.