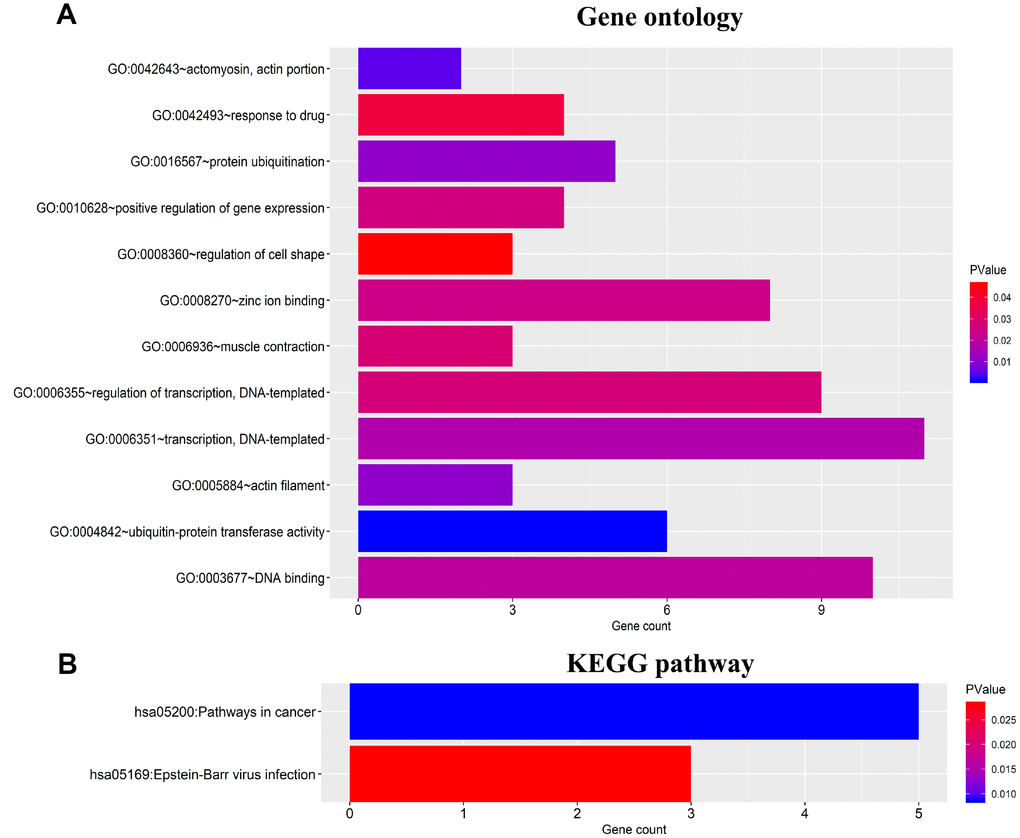
Figure 7.Functional enrichment analysis for 46 target genes of the four miRNAs. (A) Gene ontology (GO) enrichment analysis. (B) Kyoto Encyclopedia of Genes and Genomes analyses (KEGG) enrichment analysis. The x-axis indicates the number of genes, and the y-axis represents the GO terms and KEGG pathway names. The color represents the P value.