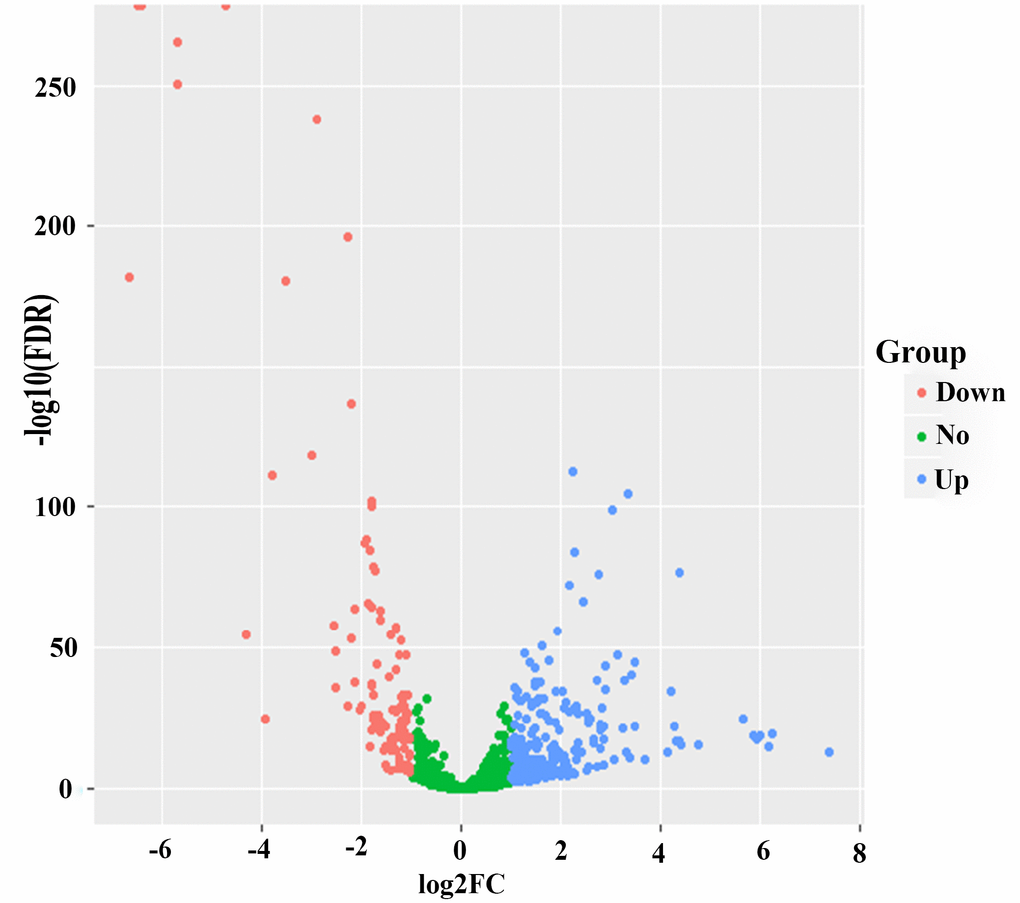
Figure 1.Volcano plot of 273 up-regulated and 108 down-regulated. Blue color represents up-regulated expression, and red color reveals down-regulated expression.
Figure 1 — Identification of a novel microRNA recurrence-related signature and risk stratification system in breast cancer | Aging