Submit an Article
Navigate
Home
Editorial Board
Editorial Policies
Current Volume
Archive
Scientific Integrity
Publication Ethics Statements
Interviews with Outstanding Authors
Newsroom
Sponsored Conferences
Podcast
Contact
Special Collections
Submit an Article
Online ISSN: 1945-4589
Research Paper
|
Volume 11, Issue 18
|
pp. 7457–7472
Increased interleukin-18 level contributes to the development and severity of ischemic stroke
Back to article
Figure 7
(7 of 7)
−
100%
+
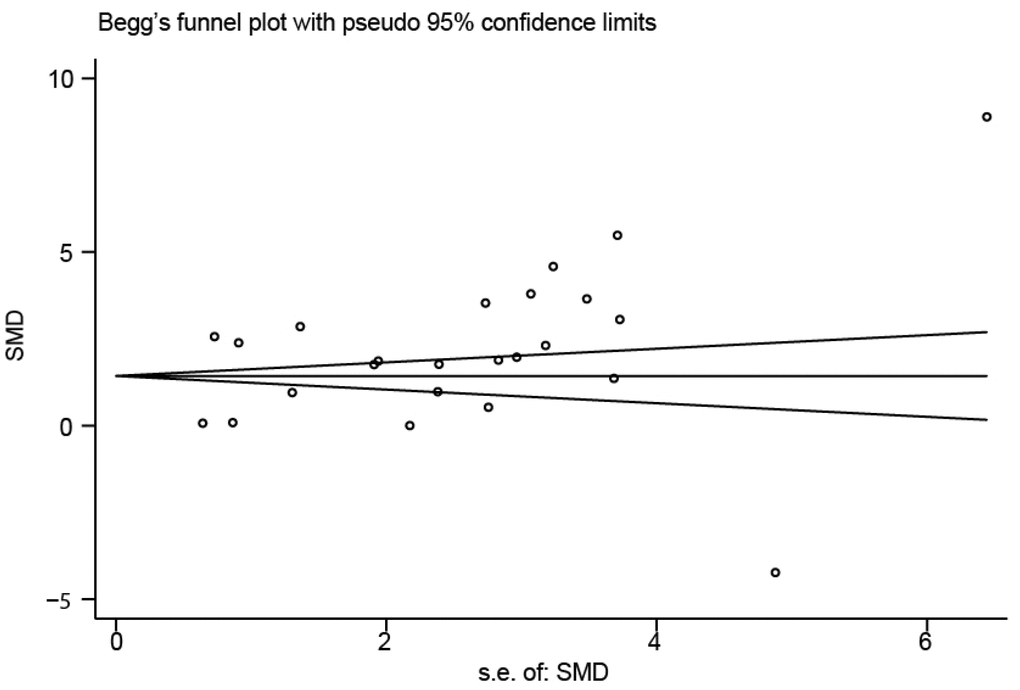
Figure 7.
Funnel plot of publication biases on the difference of interleukin-18 levels between stroke patients and healthy controls.