Submit an Article
Navigate
Home
Editorial Board
Editorial Policies
Current Volume
Archive
Scientific Integrity
Publication Ethics Statements
Interviews with Outstanding Authors
Newsroom
Sponsored Conferences
Podcast
Contact
Special Collections
Submit an Article
Online ISSN: 1945-4589
Research Paper
|
Volume 11, Issue 18
|
pp. 7442–7456
Analyses of an epigenetic switch involved in the activation of pioneer factor FOXA1 leading to the prognostic value of estrogen receptor and FOXA1 co-expression in breast cancer
Back to article
Figure 1
(1 of 11)
−
100%
+
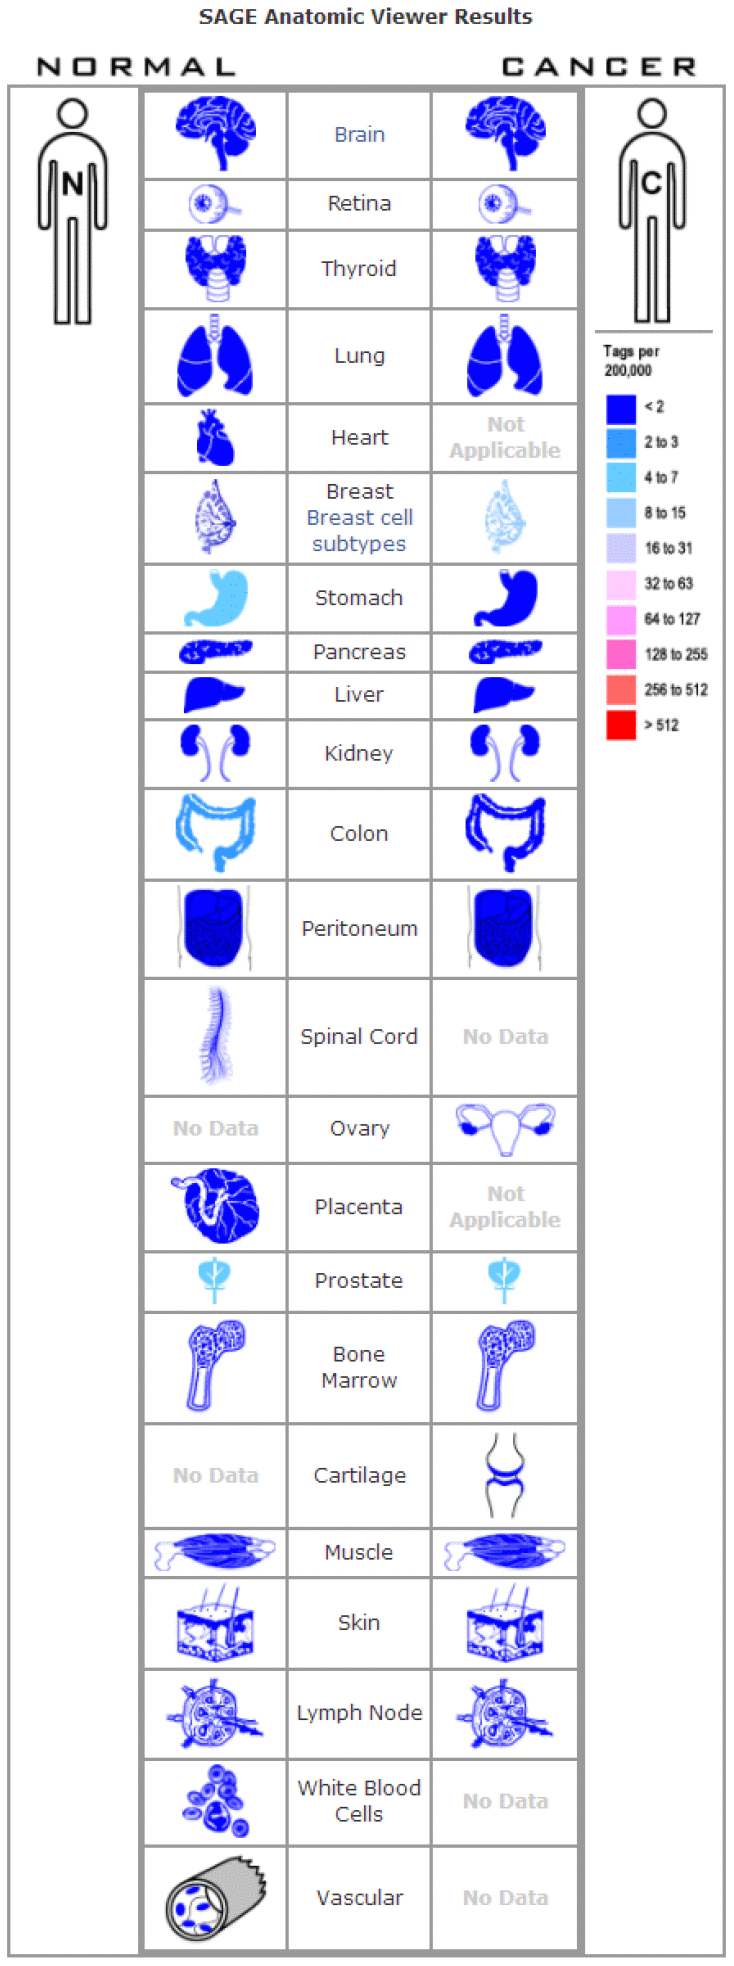
Figure 1.
Digital FOXA1 gene expression profiles were analyzed and displayed using the SAGE Anatomic Viewer.