Submit an Article
Navigate
Home
Editorial Board
Editorial Policies
Current Volume
Archive
Scientific Integrity
Publication Ethics Statements
Interviews with Outstanding Authors
Newsroom
Sponsored Conferences
Podcast
Contact
Special Collections
Submit an Article
Online ISSN: 1945-4589
Research Paper
|
Volume 11, Issue 17
|
pp. 7197–7205
A cohort study of antihyperglycemic medication exposure and survival in patients with gastric cancer
Back to article
Figure 2
(2 of 3)
−
100%
+
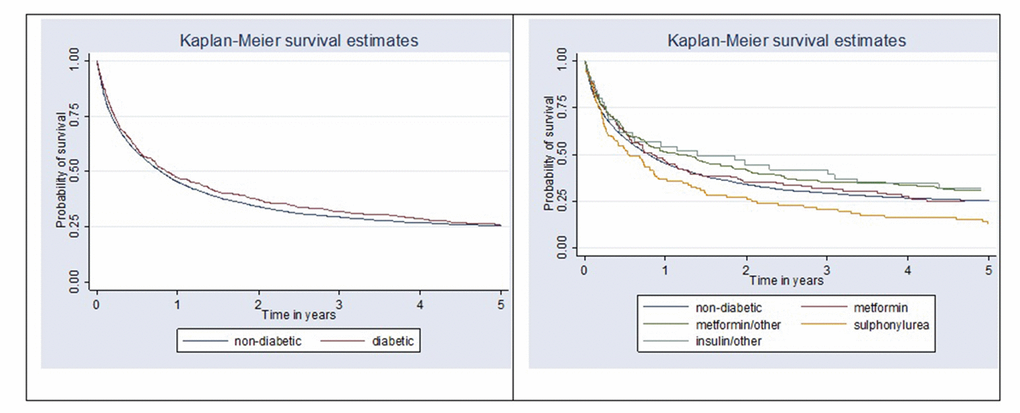
Figure 2.
Kaplan-Meier survival curves comparing gastric cancer-specific survival between non-diabetic and diabetic patients (p = 0.29) and by antihyperglycemic medication user group (p=0.013).