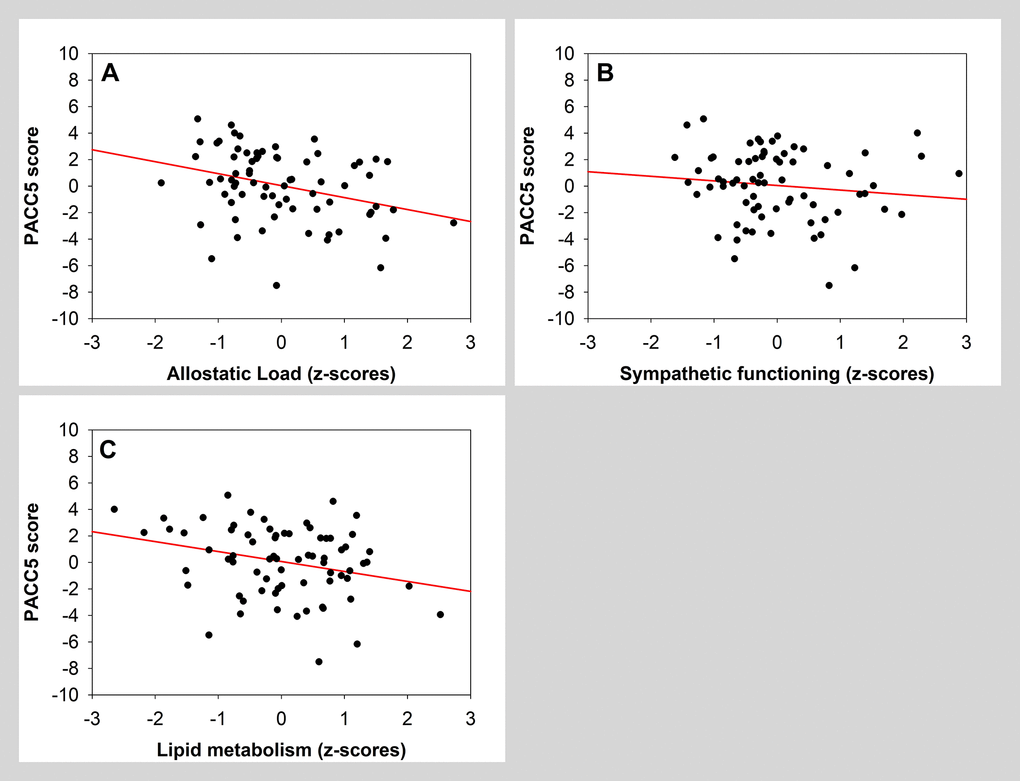
Figure 2.Scatter plots visualizing association between PACC5 and measures of allostatic load (global measure, sympathetic functioning and lipid metabolism). Regressions were used for visual display only, and not as a substitute of the full GLMM statistics presented in Table 5.