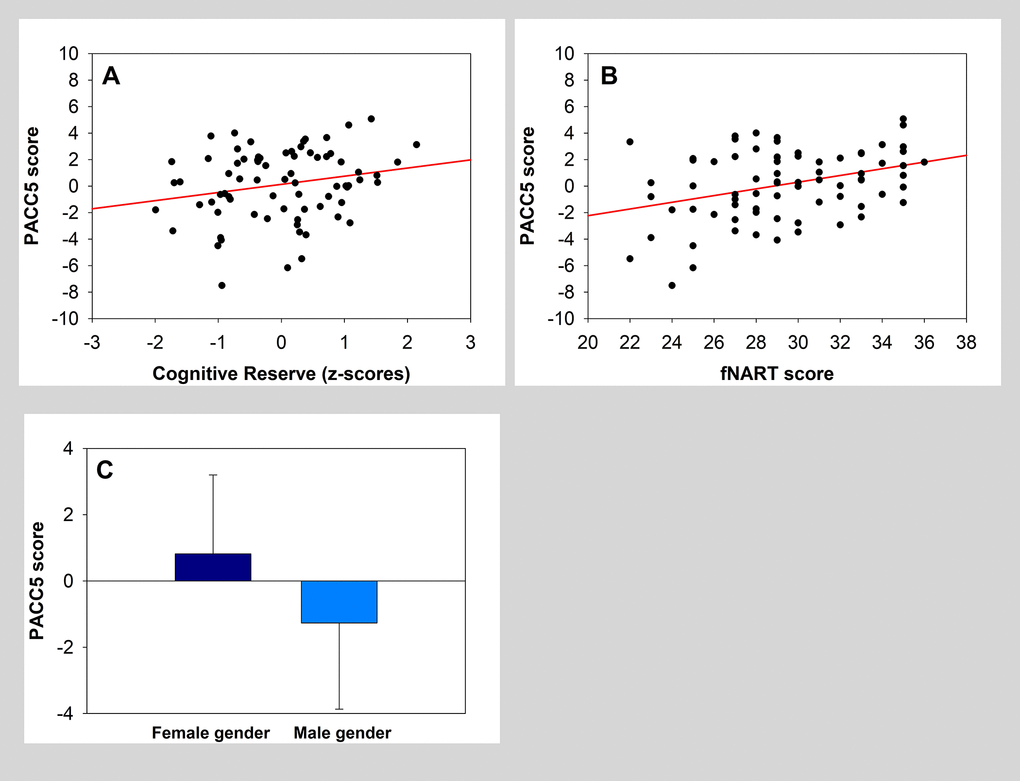
Figure 1.(A, B) Scatter plots visualizing the association between PACC5 and cognitive reserve measures (global measure and fNART). Regressions were used for visual display only, and not as a substitute for the full GLMM statistics presented in Table 3. (C) Bar plot visualizing PACC5 score according to sex.