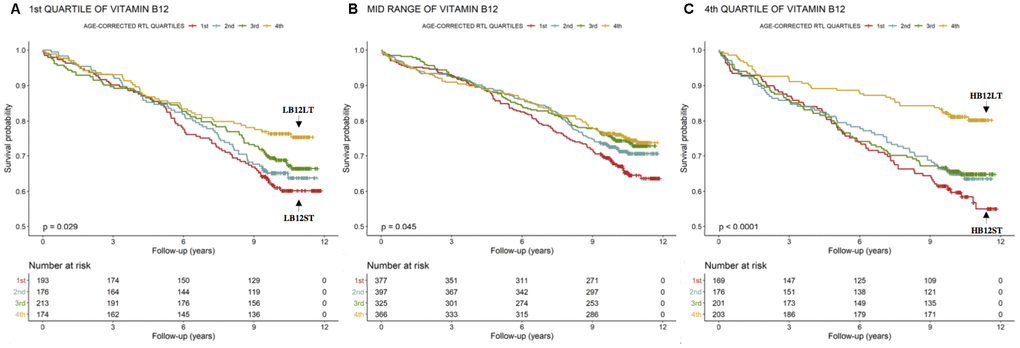
Figure 2.Kaplan-Meier plots. Cumulative survival according to age-corrected RTL within the 1st, mid-range and 4th quartiles of B12.
Figure 2 — Telomere length, vitamin B12 and mortality in persons undergoing coronary angiography: the Ludwigshafen risk and cardiovascular health study | Aging