Submit an Article
Navigate
Home
Editorial Board
Editorial Policies
Current Volume
Archive
Scientific Integrity
Publication Ethics Statements
Interviews with Outstanding Authors
Newsroom
Sponsored Conferences
Podcast
Contact
Special Collections
Submit an Article
Online ISSN: 1945-4589
Research Paper
|
Volume 11, Issue 17
|
pp. 7083–7097
Telomere length, vitamin B12 and mortality in persons undergoing coronary angiography: the Ludwigshafen risk and cardiovascular health study
Back to article
Figure 1
(1 of 3)
−
100%
+
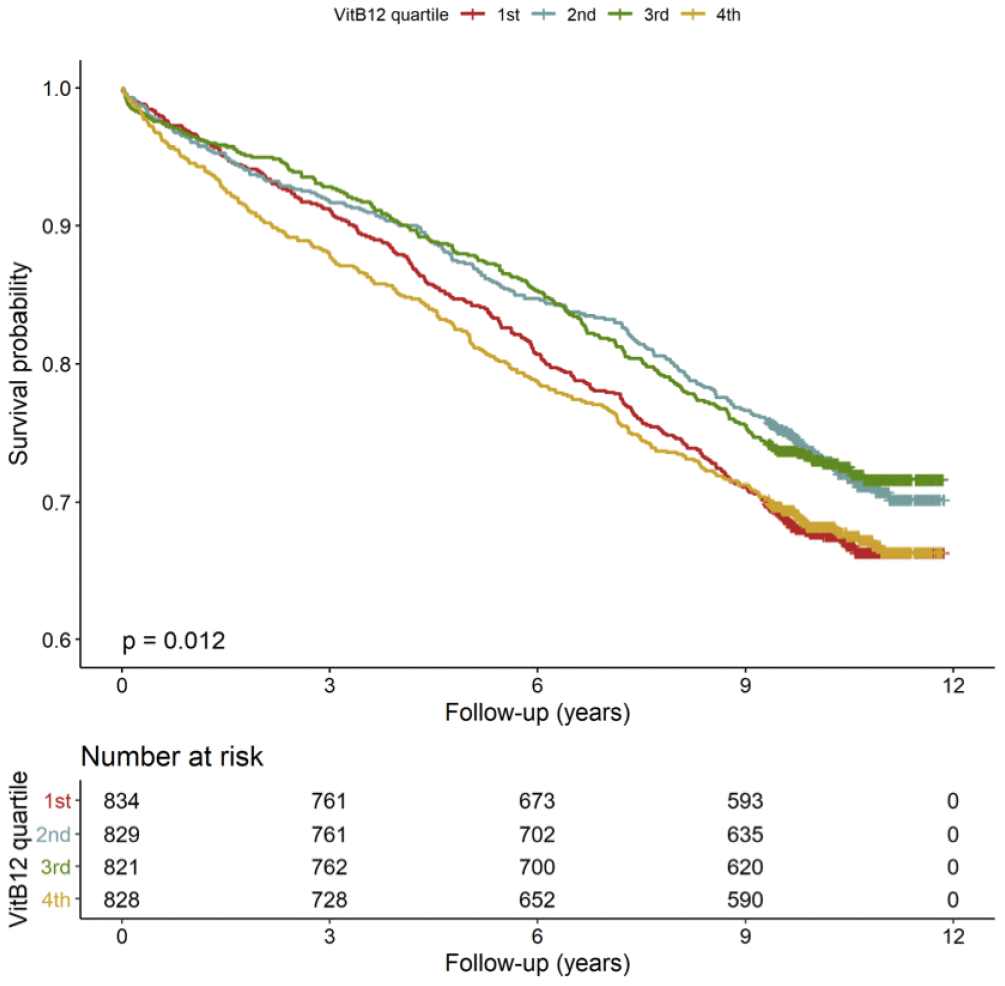
Figure 1.
Kaplan-Meier plots.
Cumulative survival according to quartiles of B12 (n=3312).