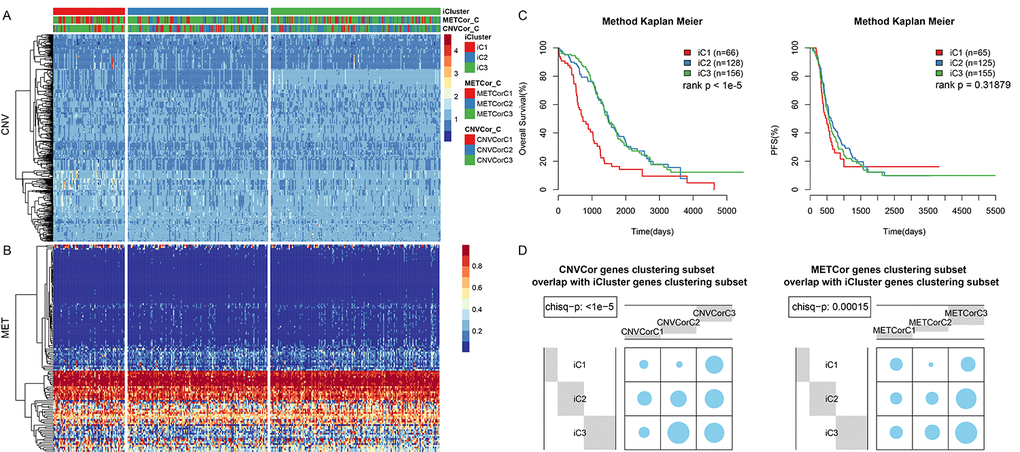
Figure 3.OV sample molecular typing results in multiple datasets. (A) Expression heatmap for CNVcor gene subsets identified by iCluster. (B) Expression heatmap for METcor gene subsets identified by iCluster. (C) OS and PFS curves for subtypes identified by iCluster. (D) Overlap between METcor and CNVcor gene subsets with iCluster gene subsets. Blue circles represent the proportion of overlapping samples between two clusters; significance was determined using the Kolmogorov-Smirnov test.