Submit an Article
Navigate
Home
Editorial Board
Editorial Policies
Current Volume
Archive
Scientific Integrity
Publication Ethics Statements
Interviews with Outstanding Authors
Newsroom
Sponsored Conferences
Podcast
Contact
Special Collections
Submit an Article
Online ISSN: 1945-4589
Research Paper
|
Volume 11, Issue 12
|
pp. 4145–4158
Intestinal stem cells acquire premature senescence and senescence associated secretory phenotype concurrent with persistent DNA damage after heavy ion radiation in mice
Back to article
Figure 7
(7 of 7)
−
100%
+
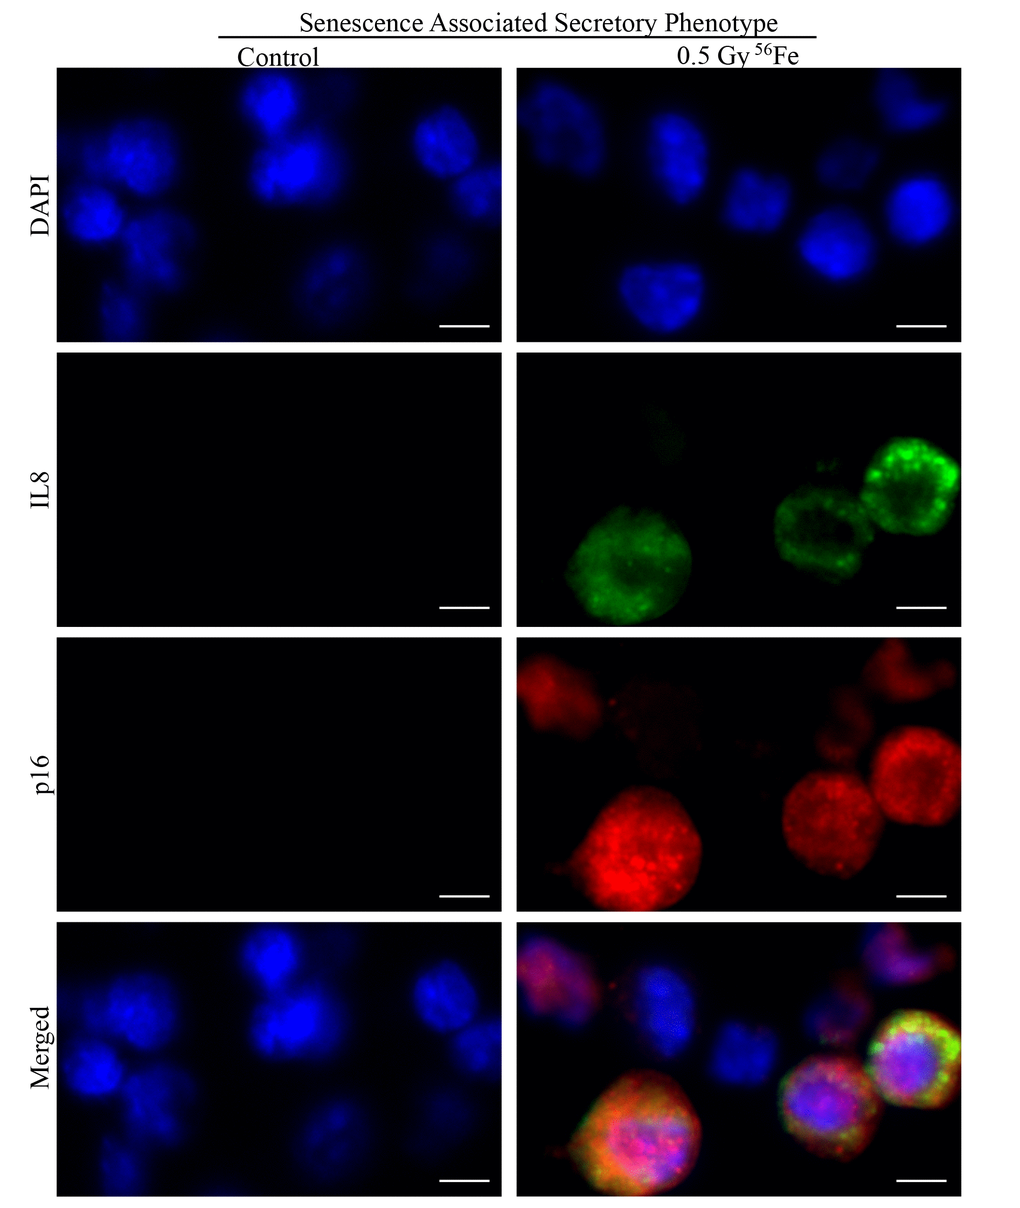
Figure 7.
Representative IF images of ISC sections co-stained for SASP marker IL8 (green) and senescent marker p16 (red) showing some of the senescent cells acquiring secretory phenotype in irradiated samples. Scale bar, 5 μm.