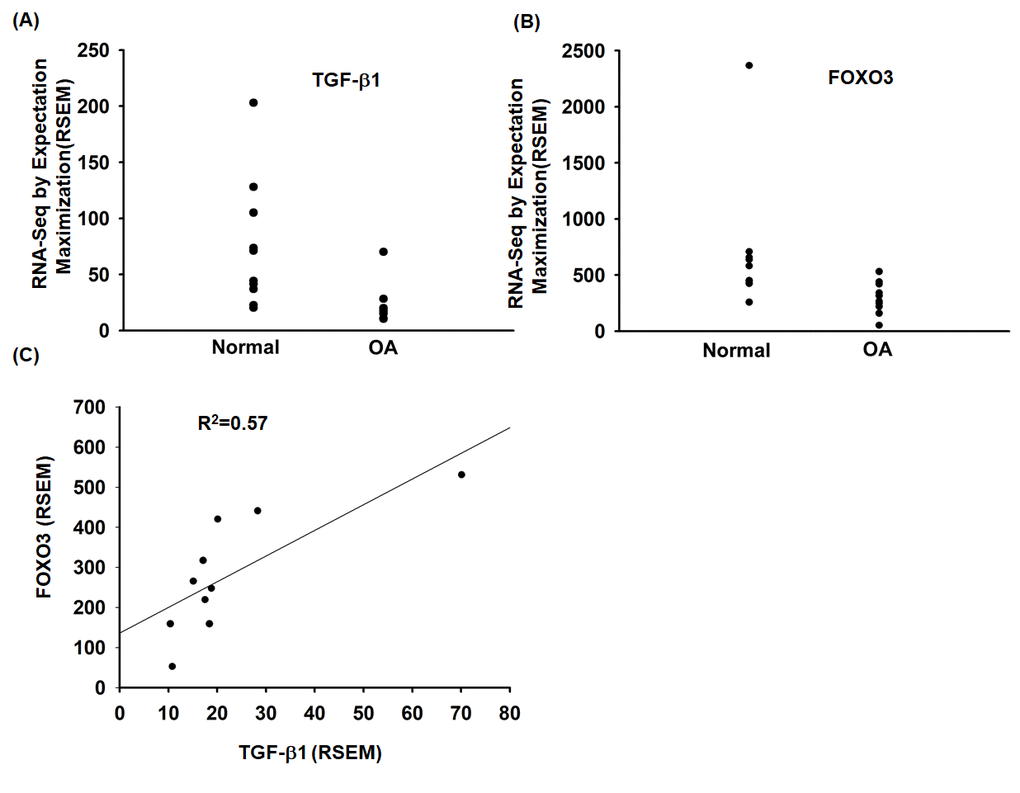
Figure 6.The TGF-β1 and FOXO3 expression in OA patients. (A, B) Expression levels of TGF-β1 and FOXO3 in paired normal and OA tissues retrieved from the GEO dataset records (GDS5403). (C) Correlation between TGF-β1 and FOXO3 expression levels in OA specimens retrieved from the GEO dataset.