Submit an Article
Navigate
Home
Editorial Board
Editorial Policies
Current Volume
Archive
Scientific Integrity
Publication Ethics Statements
Interviews with Outstanding Authors
Newsroom
Sponsored Conferences
Podcast
Contact
Special Collections
Submit an Article
Online ISSN: 1945-4589
Research Paper
|
Volume 11, Issue 12
|
pp. 3939–3957
B7-CD28 gene family expression is associated with prognostic and immunological characteristics of diffuse large B-cell lymphoma
Back to article
Figure 5
(5 of 9)
−
100%
+
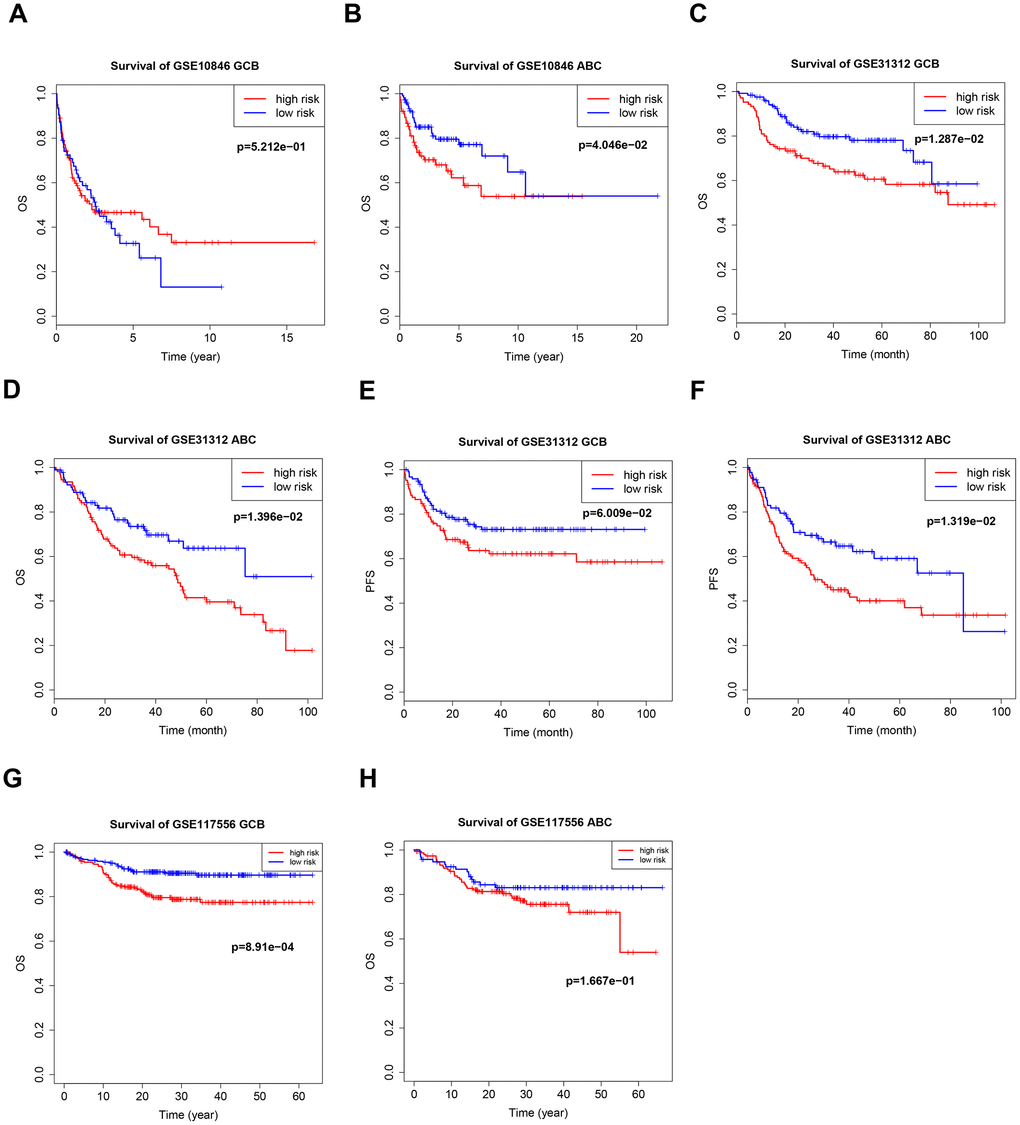
Figure 5.
Kaplan–Meier curves of overall survival (OS) and progression-free survival (PFS) in high-risk and low-risk GSE10846
(
A
,
B
), GSE31312 (
C
–
F
), and GSE117556 (
G
,
H
) patients with different cancer subtypes.