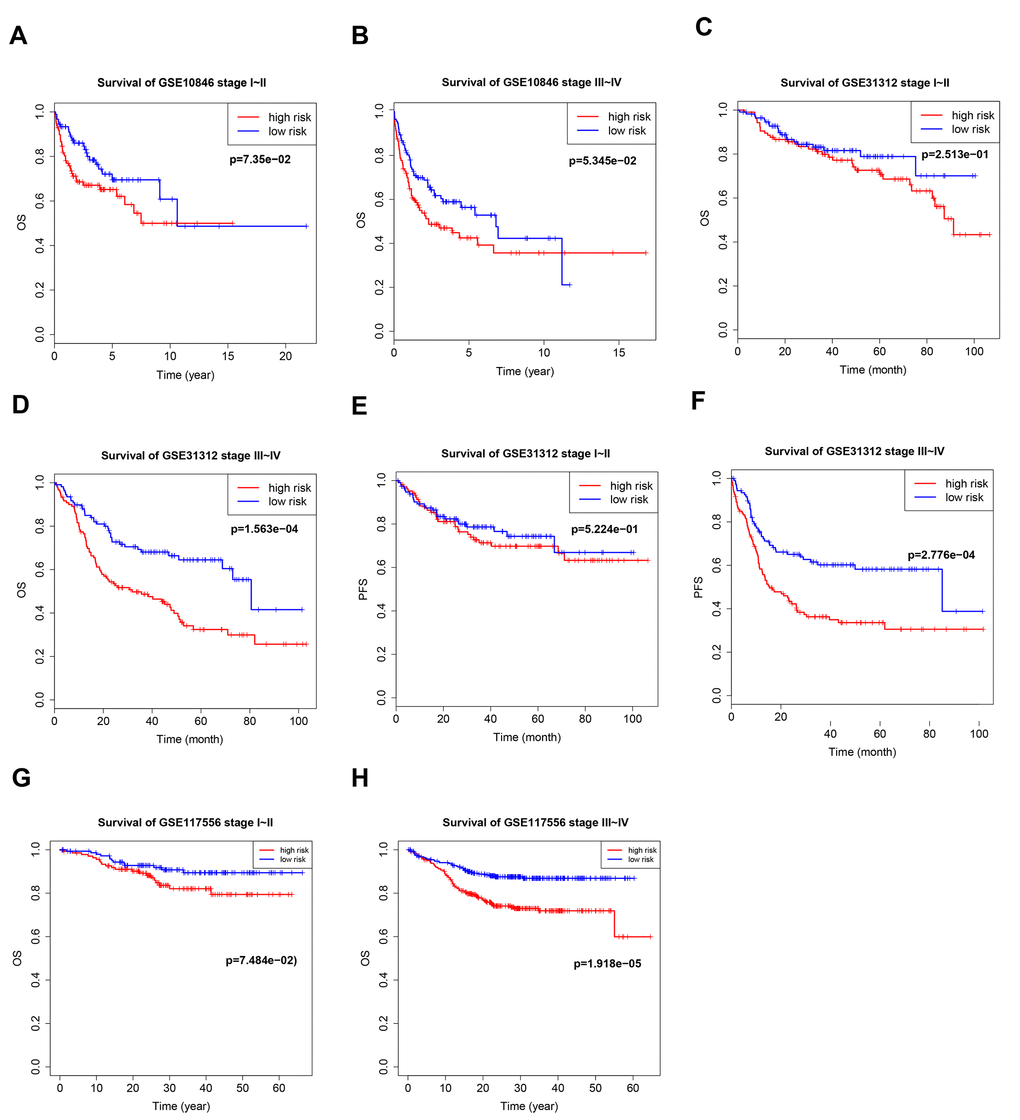
Figure 4.Kaplan–Meier curves of overall survival (OS) and progression-free survival (PFS) in high-risk and low-risk GSE10846 (A, B), GSE31312 (C–F), and GSE117556 (G, H) patients with different disease stages.
Figure 4 — B7-CD28 gene family expression is associated with prognostic and immunological characteristics of diffuse large B-cell lymphoma | Aging