Submit an Article
Navigate
Home
Editorial Board
Editorial Policies
Current Volume
Archive
Scientific Integrity
Publication Ethics Statements
Interviews with Outstanding Authors
Newsroom
Sponsored Conferences
Podcast
Contact
Special Collections
Submit an Article
Online ISSN: 1945-4589
Research Paper
|
Volume 11, Issue 11
|
pp. 3876–3890
Habitual tea drinking modulates brain efficiency: evidence from brain connectivity evaluation
Back to article
Figure 3
(3 of 5)
−
100%
+
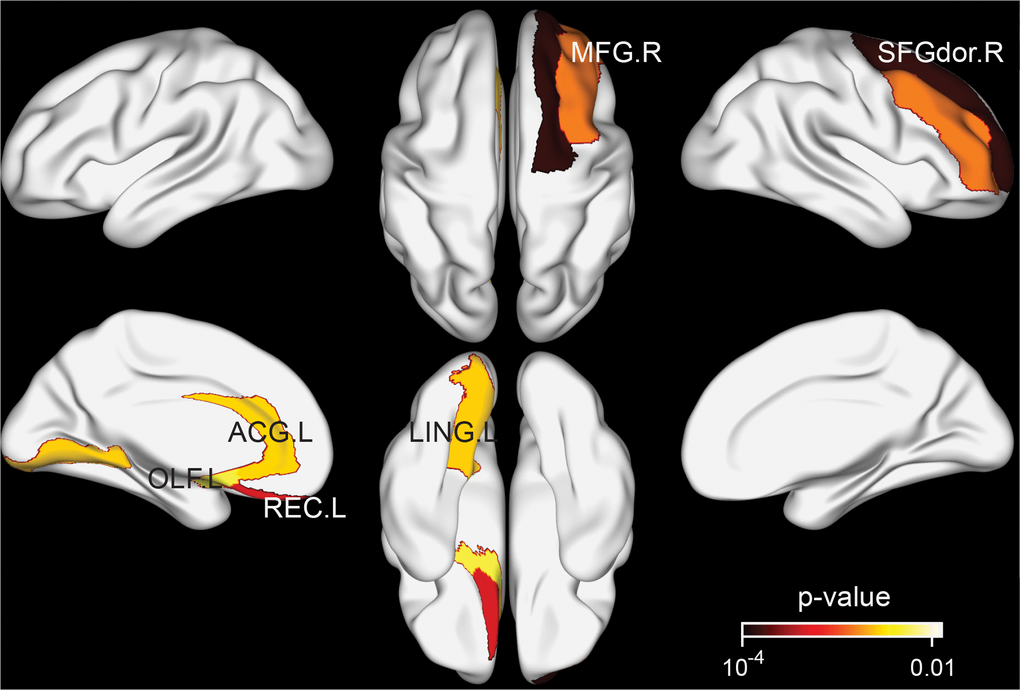
Figure 3.
Brain regions exhibiting significant differences in structural nodal efficiency between the tea drinking group and the non-tea drinking group at the significance level of 0.01 (uncorrected) statistical evaluated by a permutation test.