Submit an Article
Navigate
Home
Editorial Board
Editorial Policies
Current Volume
Archive
Scientific Integrity
Publication Ethics Statements
Interviews with Outstanding Authors
Newsroom
Sponsored Conferences
Podcast
Contact
Special Collections
Submit an Article
Online ISSN: 1945-4589
Research Paper
|
Volume 11, Issue 11
|
pp. 3785–3794
Metformin prevents murine ovarian aging
Back to article
Figure 2
(2 of 5)
−
100%
+
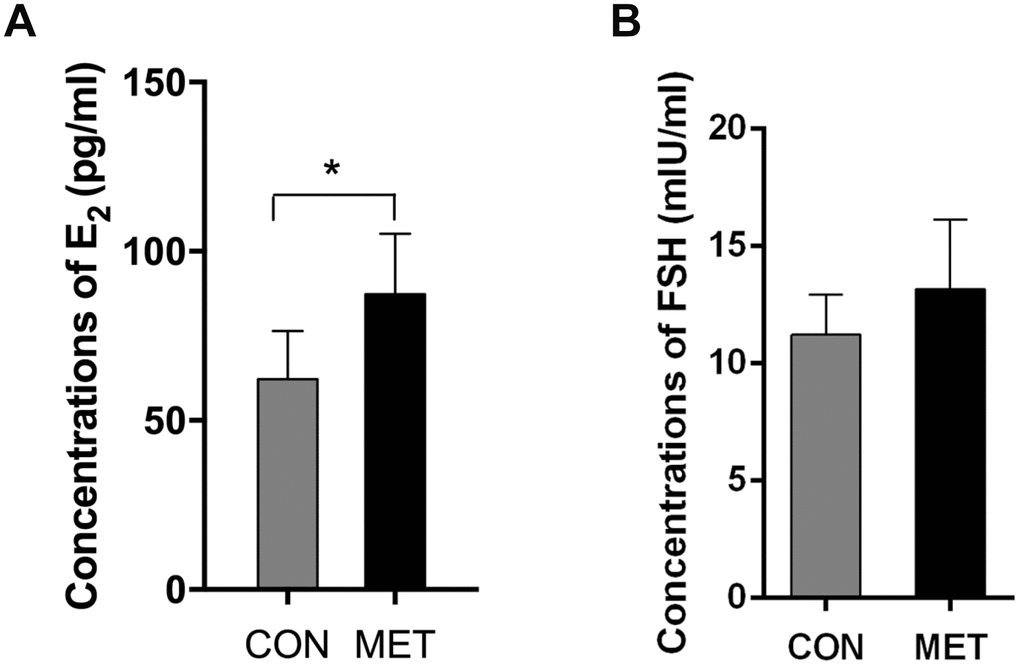
Figure 2.
E2 and FSH levels in both groups.
Data were represented as mean± S.E.M. *Compared with the CON group, *P<0.05