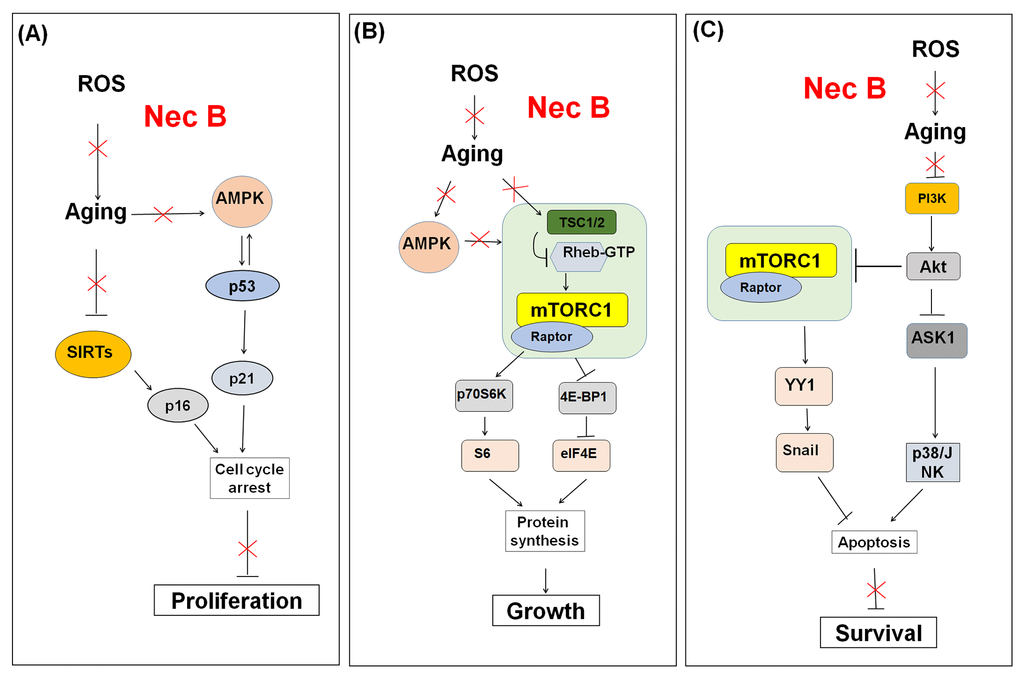
Figure 8.Schematic model for the effect of NecB on (A) cell proliferation, (B) growth, and (C) survival in near-senescent HDFs. The red color X means inhibitory effect by NecB treatment in old HDFs.
Figure 8 — Nectandrin B-mediated activation of the AMPK pathway prevents cellular senescence in human diploid fibroblasts by reducing intracellular ROS levels | Aging