Submit an Article
Navigate
Home
Editorial Board
Editorial Policies
Current Volume
Archive
Scientific Integrity
Publication Ethics Statements
Interviews with Outstanding Authors
Newsroom
Sponsored Conferences
Podcast
Contact
Special Collections
Submit an Article
Online ISSN: 1945-4589
Research Paper
|
Volume 11, Issue 11
|
pp. 3650–3667
Real-world effectiveness of medications on survival in patients with COPD-heart failure overlap
Back to article
Figure 4
(8 of 8)
−
100%
+
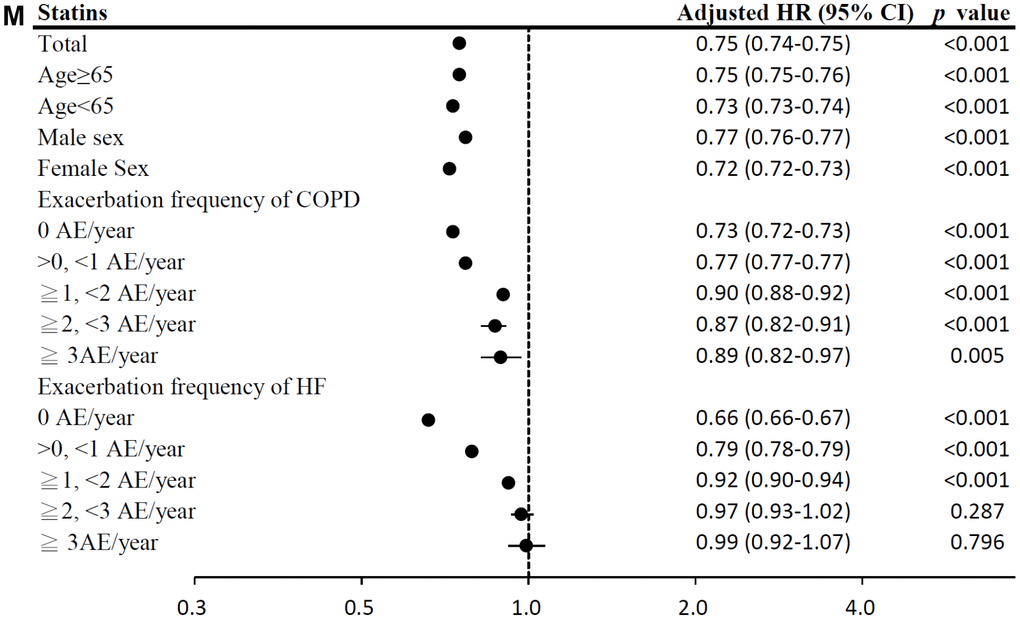
Figure 4.
(
M
) Subgroup analysis of statin.