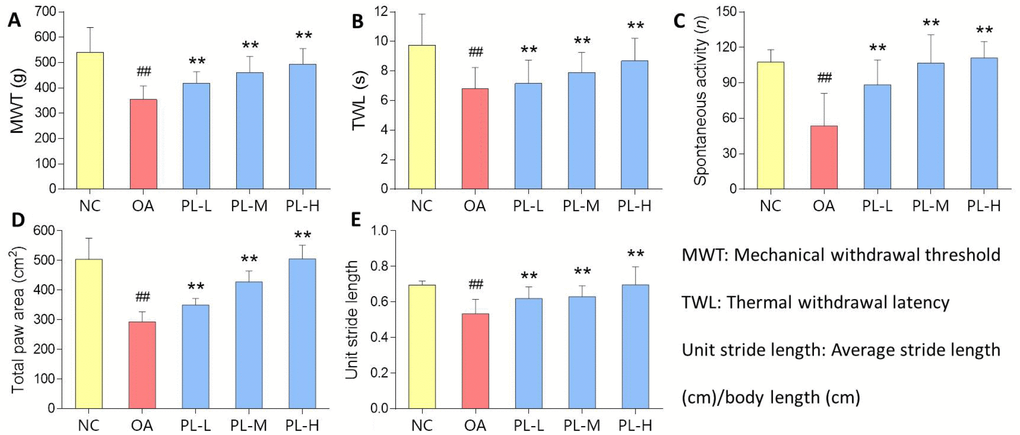
Figure 2.Pain-related behavioral results of rats with PL treatment for 4 weeks. (A) MWT (g); (B) TWL (s); (C) Spontaneous activity (n); (D) Total paw area (cm2); (E) Unit stride length. Values are shown as mean ± SD. ##P < 0.01 vs. NC group; **P < 0.01 vs. model group.