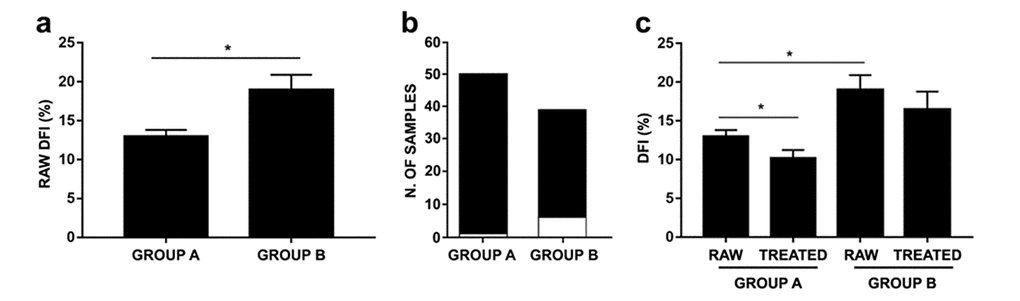
Figure 2.Effects of age on raw and DGC-treated DFI in age-stratified samples. (a) Raw DFIs belonging to Groups A and B (P=0.0122). (b) Number of samples with DFI <30% (black bar) and >30% (white bar) within Group A and B; (c) Raw and treated DFIs belonging to Groups A and B (group A: P=0.0007; group B: P=0.0692). As PureSperm® and Gradient™ DGC treatments showed comparable efficacy, analysis has been carried on using PureSperm® values. Results were expressed as mean±SEM. P value was obtained thanks to Mann-Whitney test.