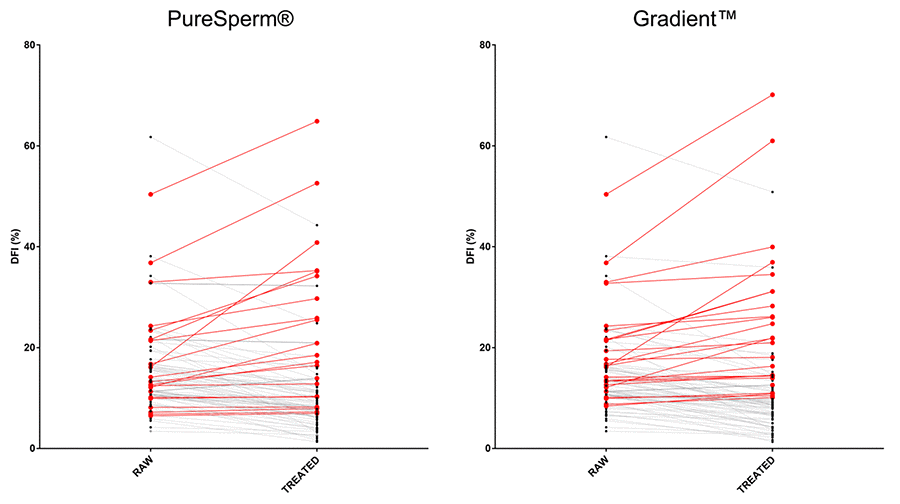
Figure 1.Effects of DGCs on single sample DFI. Graphs showed DFI values before and after DGC treatments. PS: PureSperm®; GD: Gradient™. Black and red dots/lines stand for samples showing decreased and increased DFI values after the indicated treatments, respectively.