Submit an Article
Navigate
Home
Editorial Board
Editorial Policies
Current Volume
Archive
Scientific Integrity
Publication Ethics Statements
Interviews with Outstanding Authors
Newsroom
Sponsored Conferences
Podcast
Contact
Special Collections
Submit an Article
Online ISSN: 1945-4589
Research Paper
|
Volume 11, Issue 18
|
pp. 7339–7356
Leonurine ameliorates D-galactose-induced aging in mice through activation of the Nrf2 signalling pathway
Back to article
Figure 8
(8 of 13)
−
100%
+
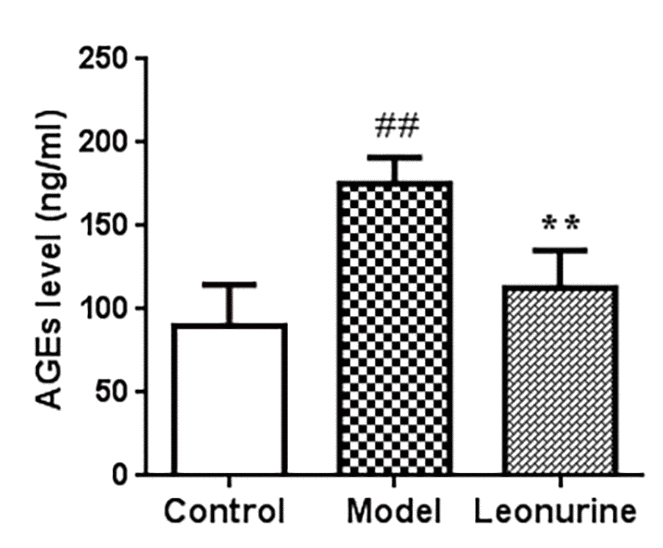
Figure 8.
Effect of leonurine on the AGEs level in serum of mice.
Data are presented as mean±SD from each group(n=12, mean±SD).
#
P
< 0.05 and
##
P
< 0.01 vs control group; *
P
< 0.05 and **
P
< 0.01 vs model group.