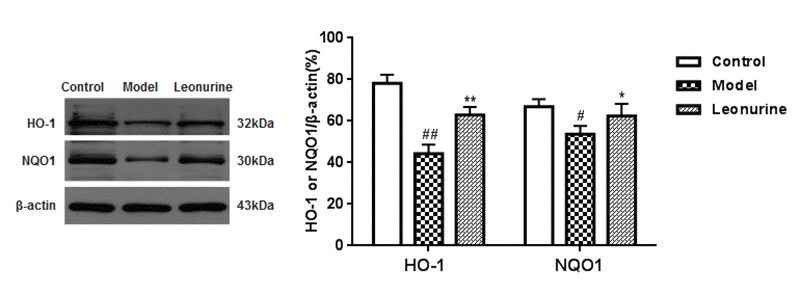
Figure 10.Effect of leonurine on the expressions of HO-1 and NQO1. Data are presented as mean±SD from each group (n=6, mean±SD). #P < 0.05 and ##P < 0.01 vs control group; *P < 0.05 and **P < 0.01 vs model group.
Figure 10 — Leonurine ameliorates D-galactose-induced aging in mice through activation of the Nrf2 signalling pathway | Aging