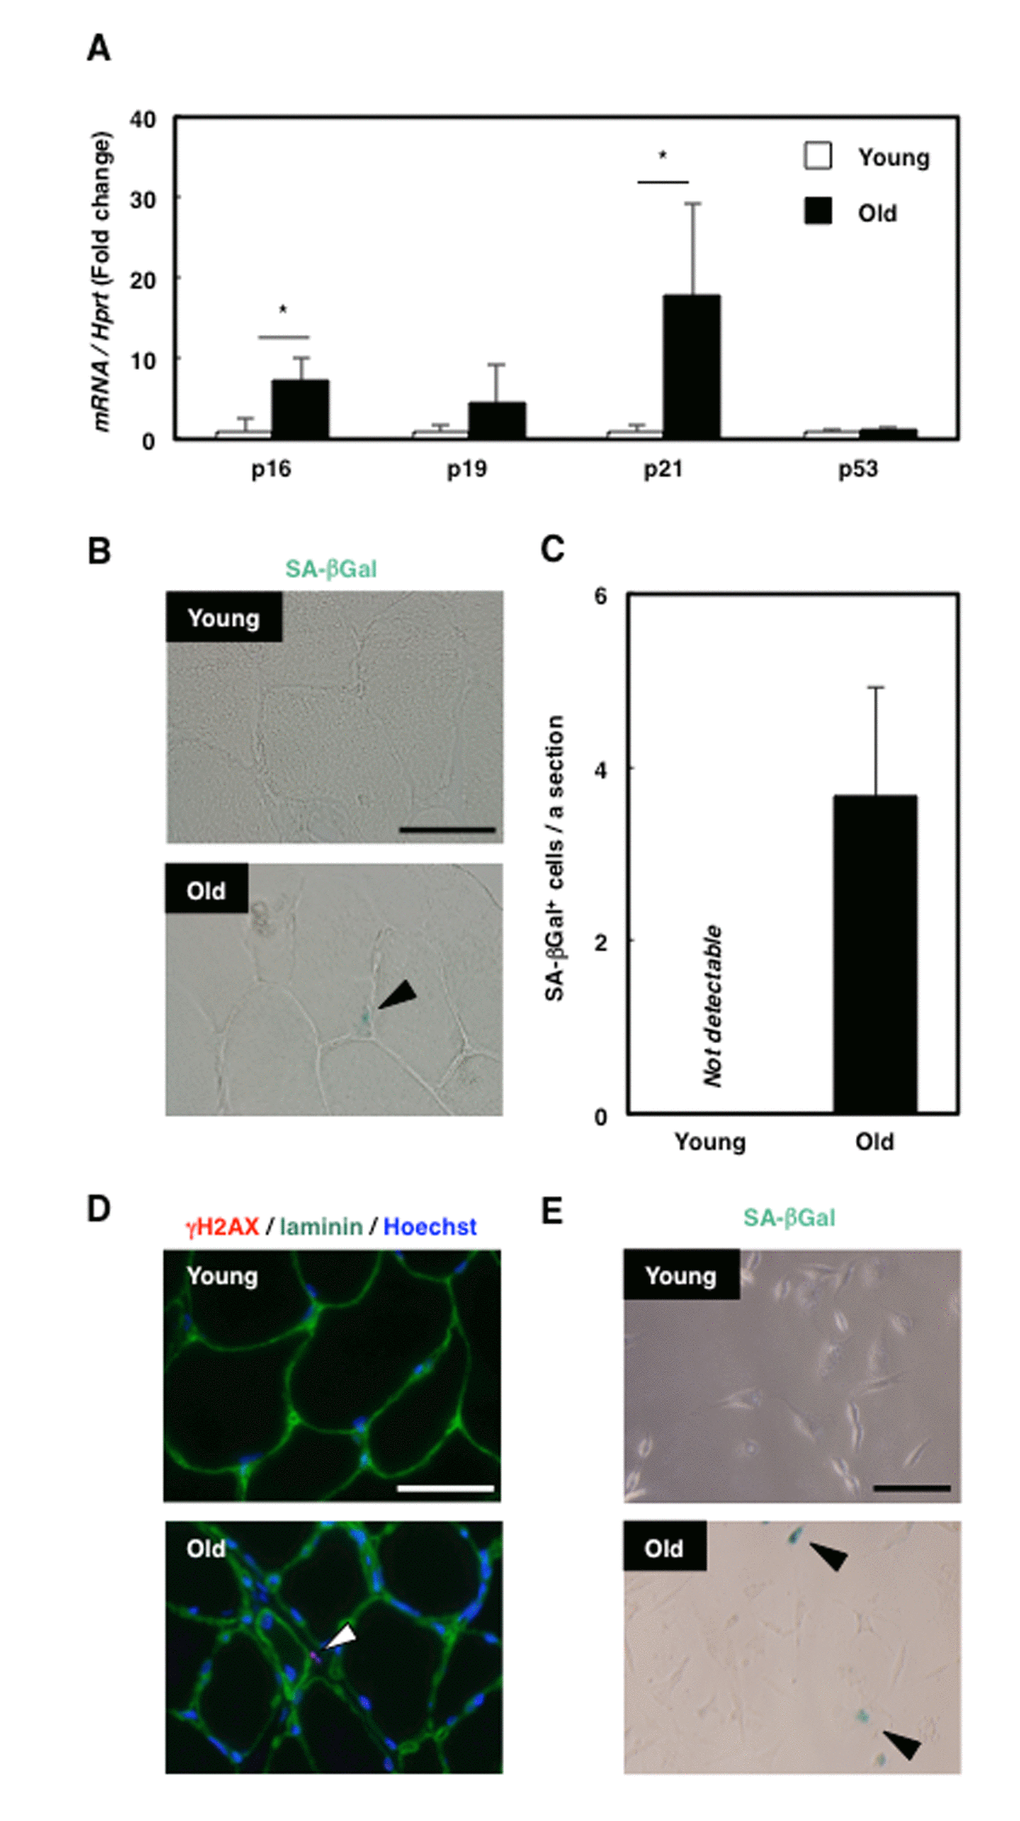
Figure 1.Senescent mesenchymal cells appeared in old rat skeletal muscle. (A) Quantification of mRNA levels of senescence markers in young and old rat skeletal muscle. Data are expressed as means±SE (n=4); *P<0.05. (B) SA-βGal staining in TA muscle sections from young and old rats. Black arrowhead: SA-βGal+ cell. Scale bar: 50 μm. (C) Quantification of SA-βGal+ cells per section. Data are expressed as means±SE (n=3). (D) Immunohistochemical analysis of γH2AX and laminin in TA muscle sections from young and old rats. White arrowhead: γH2AX+ cell. Scale bar: 50 μm. (E) SA-βGal staining of primary skeletal muscle cells from young and old rats. Black arrowheads: SA-βGal+ cells. Scale bar: 50 μm.