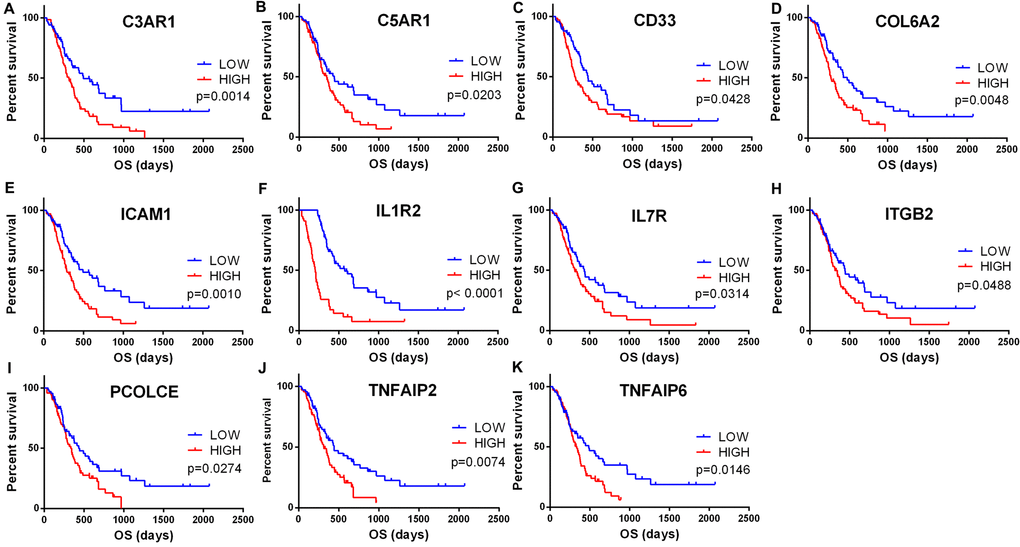
Figure 6.Validation of correlation of DEGs extracted from TCGA database with overall survival in CGGA cohort. Kaplan-Meier survival curves were generated for selected DEGs extracted from the comparison of groups of high (red line) and low (blue line) gene expression. p<0.05 in Log-rank test. OS, overall survival in days.