Submit an Article
Navigate
Home
Editorial Board
Editorial Policies
Current Volume
Archive
Scientific Integrity
Publication Ethics Statements
Interviews with Outstanding Authors
Newsroom
Sponsored Conferences
Podcast
Contact
Special Collections
Submit an Article
Online ISSN: 1945-4589
Research Paper
|
Volume 10, Issue 4
|
pp. 561–572
The evolution of CpG density and lifespan in conserved primate and mammalian promoters
Back to article
Figure 4
(4 of 5)
−
100%
+
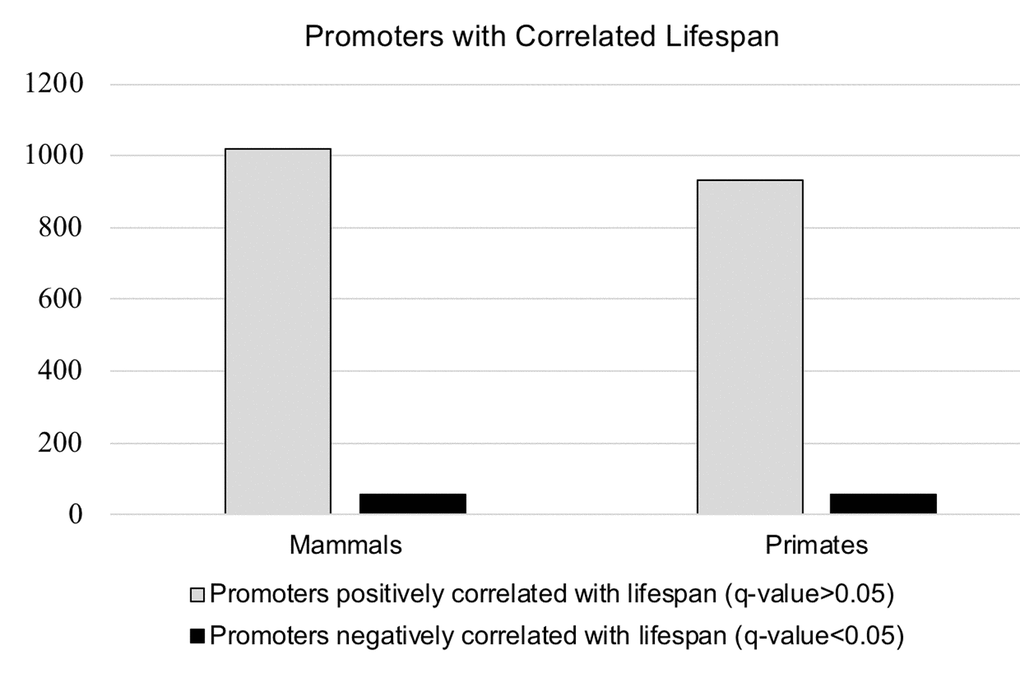
Figure 4.
Visualization of the data presented in
Table 2
.
The number of promoters correlated with lifespan in the entire mammalian dataset, and in the primate dataset only.