Submit an Article
Navigate
Home
Editorial Board
Editorial Policies
Current Volume
Archive
Scientific Integrity
Publication Ethics Statements
Interviews with Outstanding Authors
Newsroom
Sponsored Conferences
Podcast
Contact
Special Collections
Submit an Article
Online ISSN: 1945-4589
Research Paper
|
Volume 9, Issue 2
|
pp. 381–392
MiR-146a and miR-196a-2 polymorphisms are associated with hepatitis virus-related hepatocellular cancer risk: a meta-analysis
Back to article
Figure 5
(5 of 5)
−
100%
+
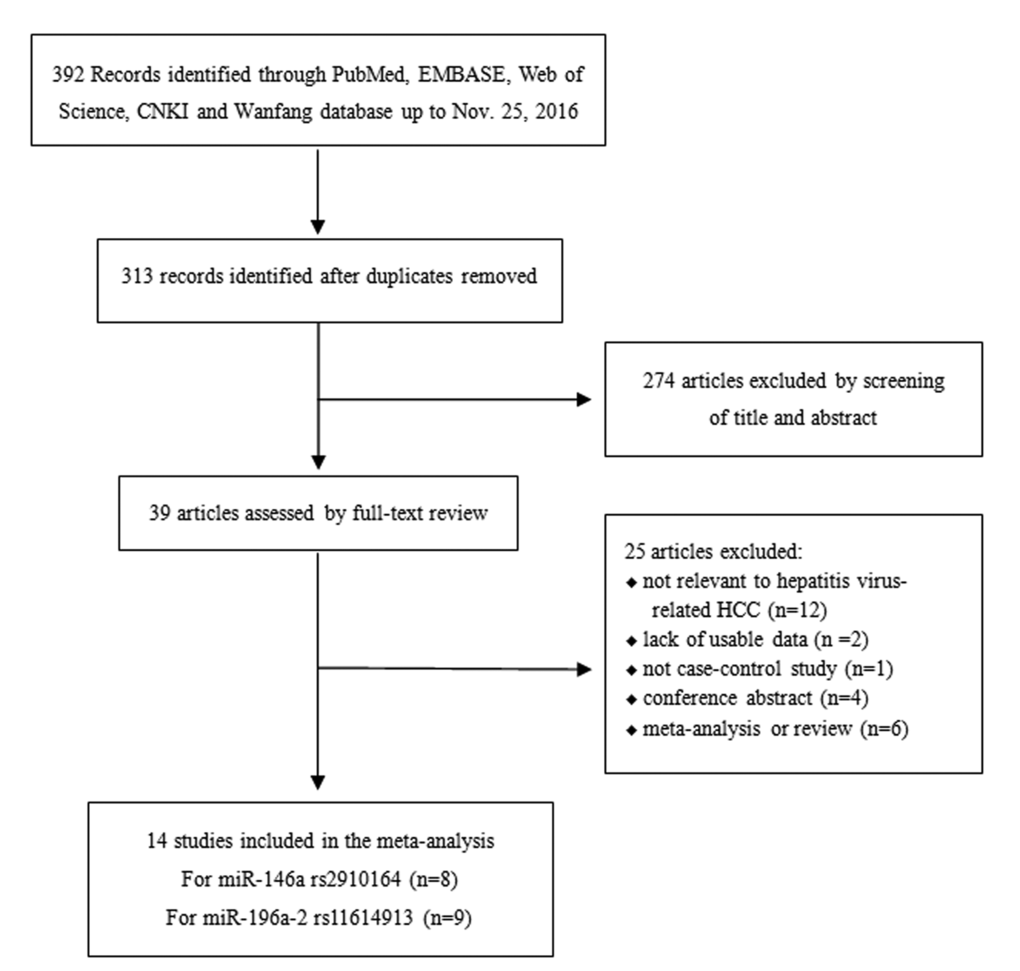
Figure 5.
The flow chart illustrating the selection process of included studies.