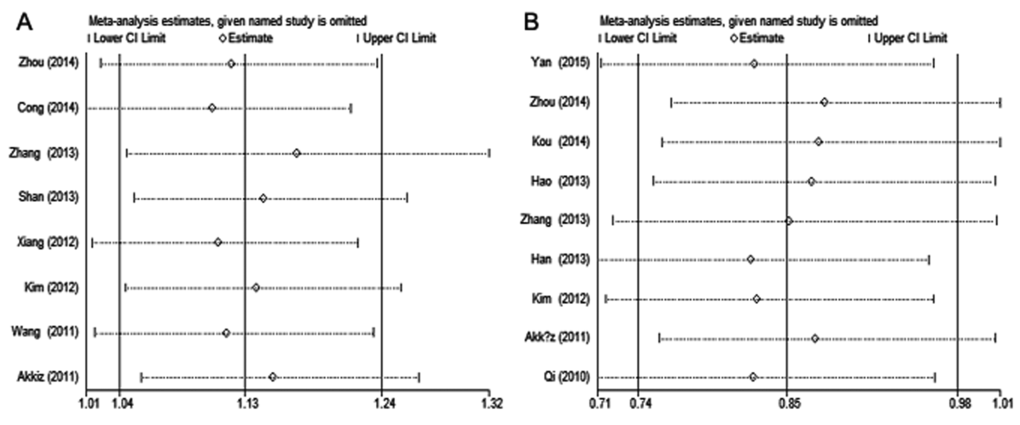
Figure 3.Sensitivity analysis of hepatitis virus-related HCC risk associated with (A) miR-146a rs2910164 and (B) miR-196a-2 rs11614913 under the allelic model. Pooled ORs were computed by omitting each study (left column) in turn. The two ends of the dotted lines represent the 95% CI.