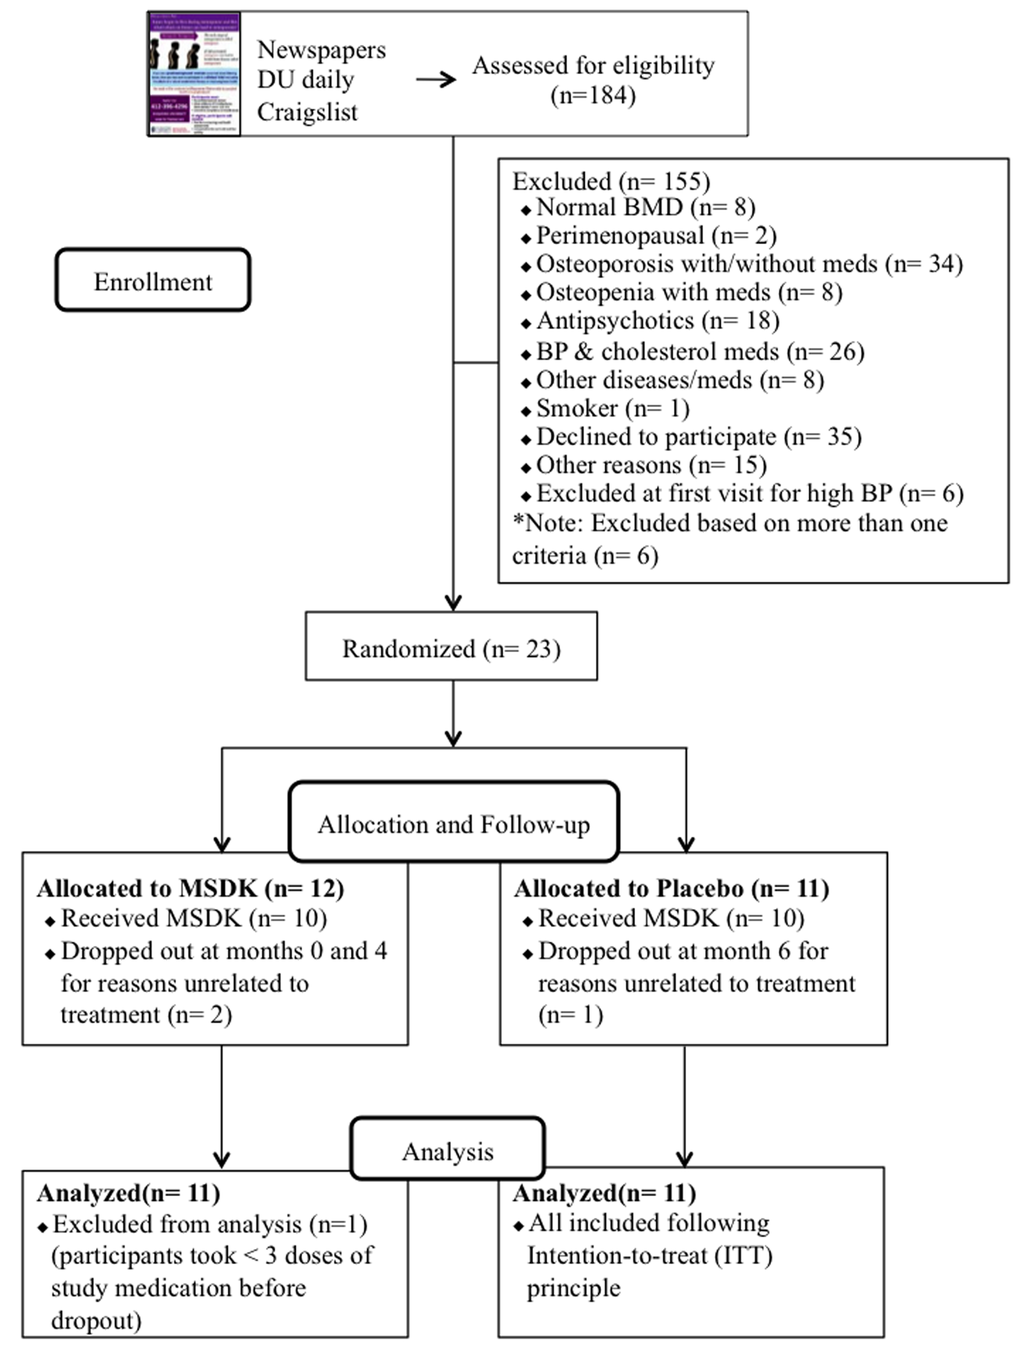
Figure 1.Flow chart of study subject recruitment and enrollment.
Figure 1 — Melatonin-micronutrients Osteopenia Treatment Study (MOTS): a translational study assessing melatonin, strontium (citrate), vitamin D3 and vitamin K2 (MK7) on bone density, bone marker turnover and health related quality of life in postmenopausal osteopenic women following a one-year double-blind RCT and on osteoblast-osteoclast co-cultures | Aging