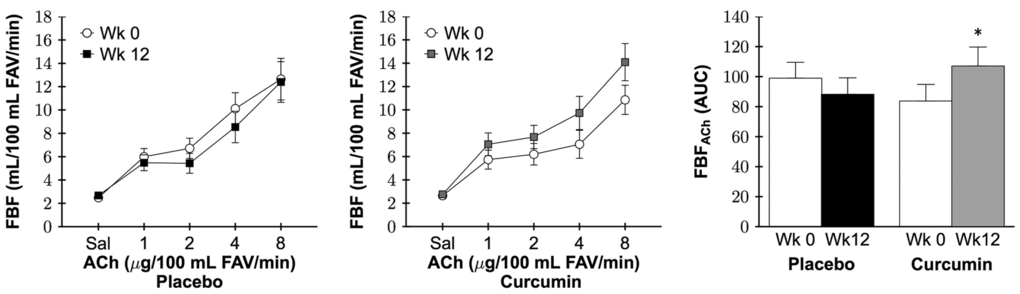
Figure 2.Forearm blood flow (FBF) in response to increasing doses (left and middle) and area under the dose-response curve (AUC; right) to acetylcholine (FBFACh) at week 0 and after 12 weeks of placebo or curcumin supplementation. Data are mean±SE; FAV, forearm volume; Group by time P=0.02, *P=0.03 vs. curcumin week 0.