Submit an Article
Navigate
Home
Editorial Board
Editorial Policies
Current Volume
Archive
Scientific Integrity
Publication Ethics Statements
Interviews with Outstanding Authors
Newsroom
Sponsored Conferences
Podcast
Contact
Special Collections
Submit an Article
Online ISSN: 1945-4589
Research Paper
|
Volume 8, Issue 12
|
pp. 3341–3355
Effects of dietary restriction on adipose mass and biomarkers of healthy aging in human
Back to article
Figure 10
(10 of 10)
−
100%
+
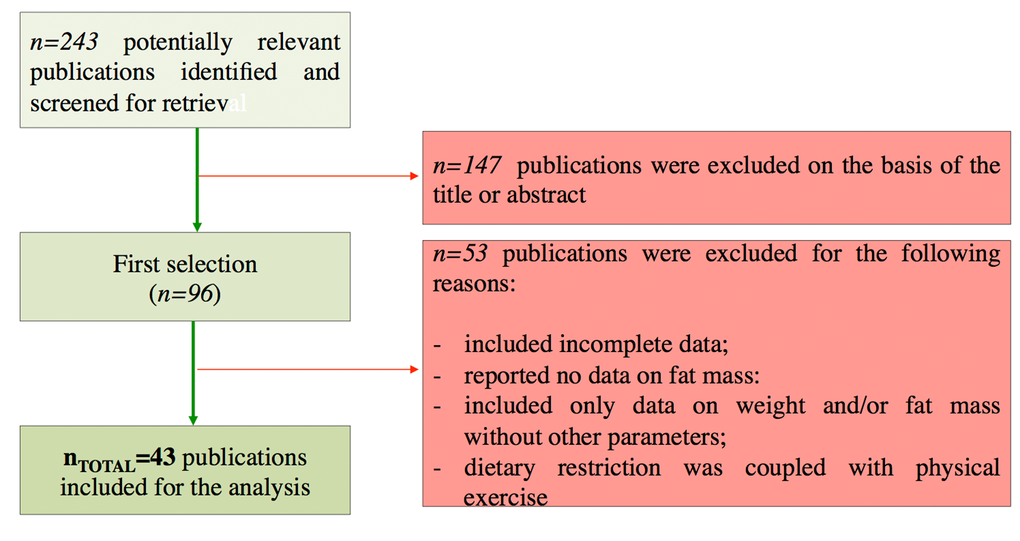
Figure 10.
Flow chart of the study identification and selection.