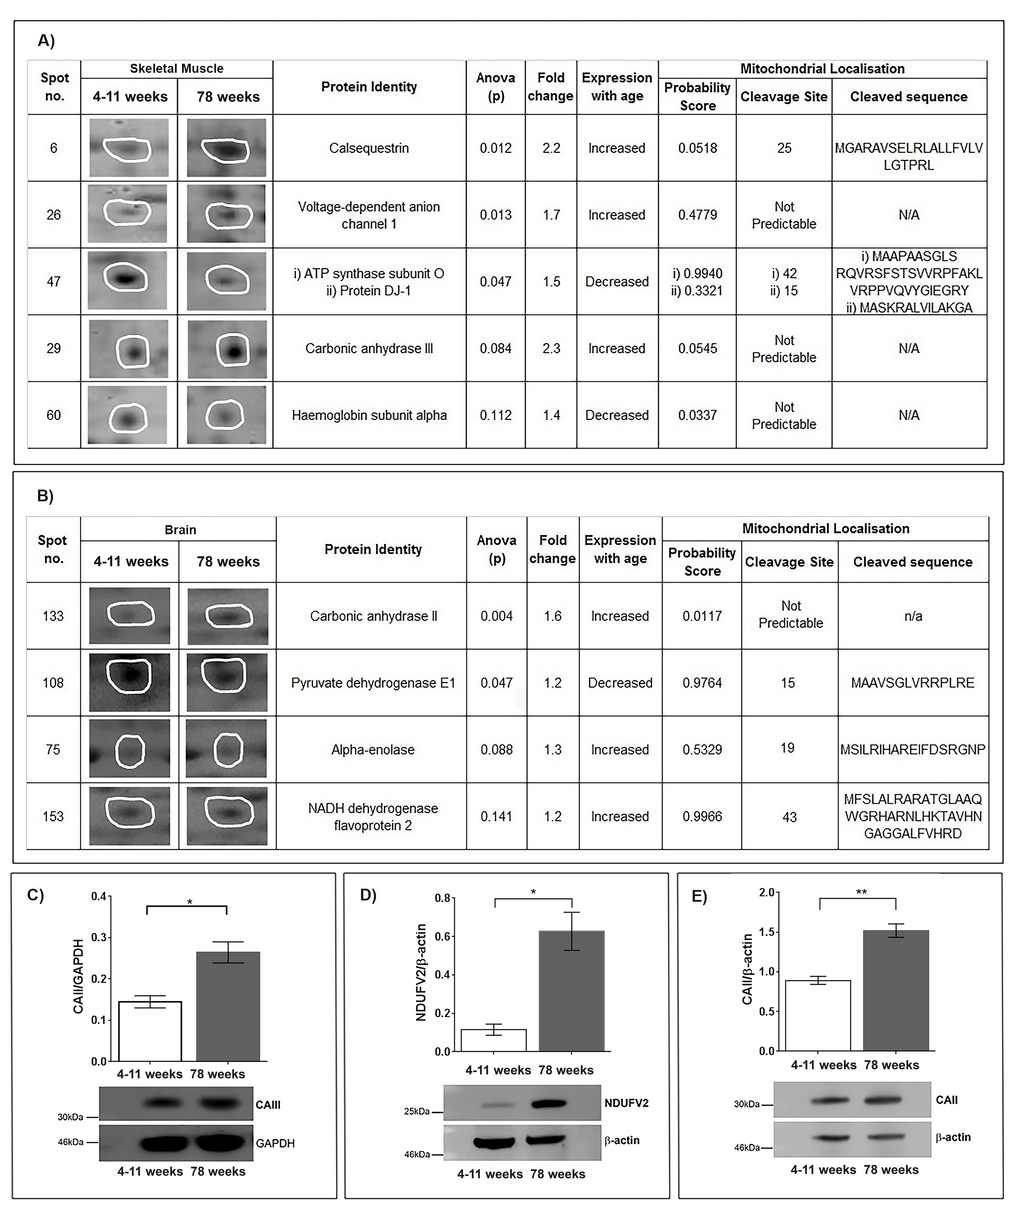
Figure 1.(A) Identification of protein changes with age in the skeletal muscle mitochondrial proteome. Five protein spots were selected after (SameSpots) analysis comparing murine skeletal muscle mitochondria aged 4-11 weeks (n=5) and 78 weeks (n=5). Representative protein spot images, statistical analyses (one-way ANOVA) and identities of the proteins (MASCOT) are shown. Mitochondrial localisation probability was calculated (Mitoprot) and is shown along with predicted cleavage sites and sequence. (B) Identification of proteins that change with age in the skeletal muscle mitochondrial proteome. Four protein spots were selected after (SameSpots) analysis comparing murine brain mitochondria aged 4-11 weeks (young) (n=3) and 78 weeks (old) (n=3). Representative protein spot images, statistical analyses (one-way ANOVA) and identities of the proteins (MASCOT) are shown. Mitochondrial localisation probability was calculated (Mitoprot) and is shown along with predicted cleavage sites and sequence. (C) Carbonic anhydrase III protein levels increase in aged skeletal muscle mitochondria. Carbonic anhydrase III, normalised to GAPDH, is significantly increased in 78 week old (n=4) skeletal muscle mitochondria compared with 4-11 week old (n=4) skeletal muscle mitochondria, p=0.0105. (D) NADH dehydrogenase flavoprotein 2 protein levels increase in aged brain mitochondria. NADH dehydrogenase flavoprotein 2, normalised to beta-actin, is significantly increased in 78 week old (n=4) brain mitochondria compared to 4-11 week old (n=4) brain mitochondria, p=0.0109. (E) Carbonic anhydrase II protein levels increase in aged brain mitochondria. Carbonic anhydrase II, normalised to beta-actin, is significantly increased in 78 week old (n=4) brain mitochondria compared to 4-11 week old (n=4) brain mitochondria p=0.0015. Columns display mean activity ± SEM. * = p<0.05 and **= p<0.03 two-tailed unpaired t-test with Welch’s correction.