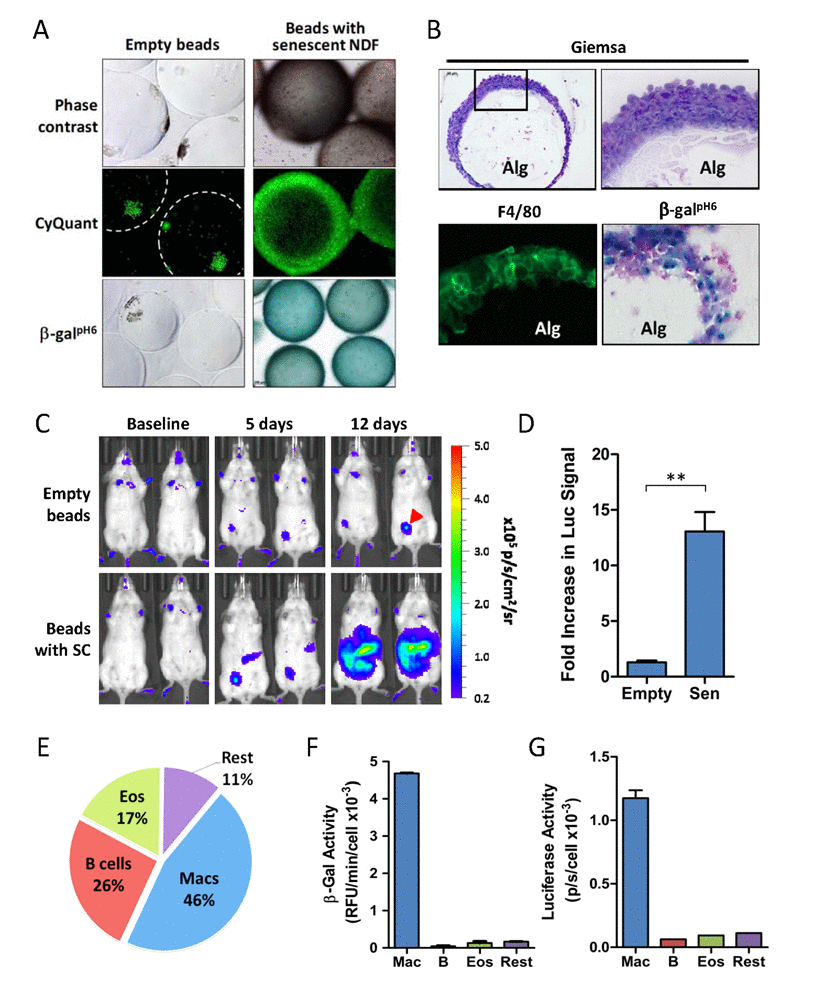
Figure 2.Accumulation of β-galpH6- and p16(Ink4a)-positive immunocytes in response to SC implantation(A) Images of whole alginate beads ex vivo (either empty or containing SCs) following retrieval from peritoneal cavity of p16LUC mice. The dense encapsulating cell layers surrounding the alginate beads were visualized by phase contrast light microscopy (top panel) or by fluorescent microscopy of samples stained with a DNA dye kit (CyQUANT™ Direct) for visualization of nuclei within live cells (middle panel). β-galpH6 staining reveals activity in cells encapsulating SC-embedded alginate beads (magnification 100x). (B) Tissue sections (15-µm) of cryopreserved SC-embedded alginate beads were stained with Geimsa for visualization of histology via light microscopy at 100x and 400x magnification (top left and right panels, respectively), for F4/80 immunofluorescence (green) for visualization of macrophages, showing specific staining of this outer membrane-localized protein (bottom left panel; 400X magnification), and for β-galpH6 activity via X-Gal substrate with nuclear fast red counterstain (400X magnification). Alginate gel containing SCs is indicated (Alg). (C) Bioluminescent in vivo imaging of p16LUC mice following i.p. inoculation of empty alginate bead (Empty) or alginate-embedded SCs (Sen). Representative serial images acquired two days before bead injection (baseline), and days 5 and 12 after injection, depict increased luminescent signal in mice bearing SCs. The colored scale depicts relative luminescent signal intensity of minimum and maximum thresholds, displayed in terms of radiance. Red arrow indicates injection site wound from alginate bead implantation. (D) The amount of bioluminescence on day 12 post-SC injection is expressed as the total flux (p/s) from the abdomen, expressed as the fold increase in signal compared to baseline measurements. (E) Analysis of the cell composition of peritoneal lavage from mice bearing SCs collected 2-3 weeks post-inoculation, as analyzed by flow cytometry on live cells immunostained for surface markers. The percent contribution to major cell types is depicted: macrophages (Mac), B lymphocytes (B cells; B), eosinophils (Eos) and remaining cell populations (Rest). This analysis depicts a representative experiment (E-G) in which these 4 cell populations were isolated via FACS and assayed for luciferase activity (F) and β-gal activity (G), normalized to cell number. The gating scheme used for FACS is presented in Supplemental Figure S1. Values depicted are means ± SEM of fold induction for each group (n = 3-6 mice/group).