Submit an Article
Navigate
Home
Editorial Board
Editorial Policies
Current Volume
Archive
Scientific Integrity
Publication Ethics Statements
Interviews with Outstanding Authors
Newsroom
Sponsored Conferences
Podcast
Contact
Special Collections
Submit an Article
Online ISSN: 1945-4589
Research Paper
|
Volume 8, Issue 7
|
pp. 1364–1374
Genetic variants determining survival and fertility in an adverse African environment: a population-based large-scale candidate gene association study
Back to article
Figure 1
(1 of 3)
−
100%
+
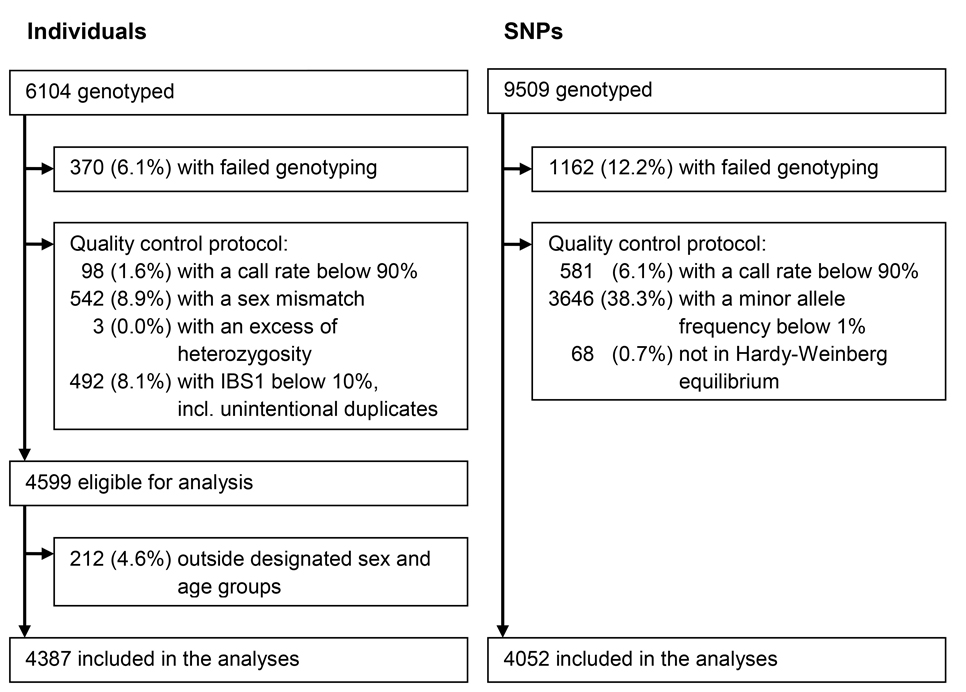
Figure 1.
Summary of the exclusions and inclusions of individuals and SNPs