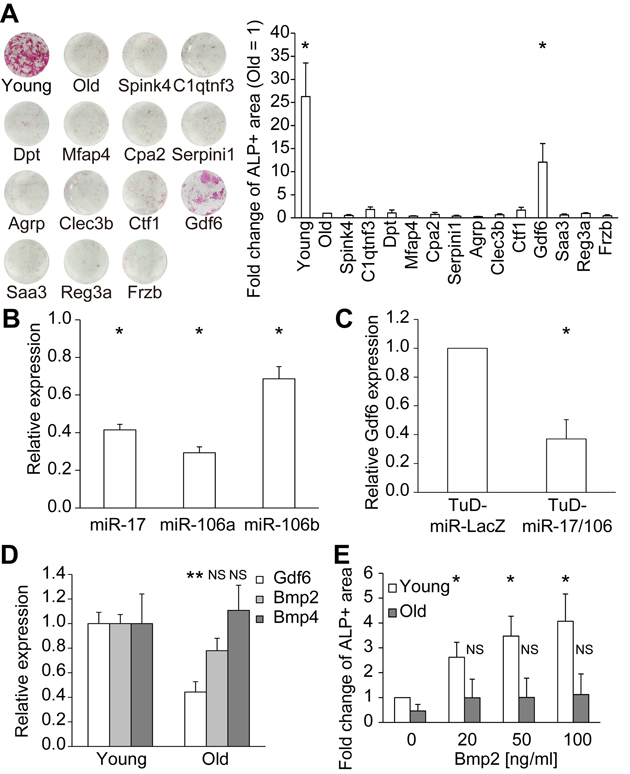
Figure 5.Identification of Gdf6 as an osteogenic factor derived from young MSCs(A) Representative images of ALP staining of differentiated MSCs. ALP activity was quantified as the percentage of ALP+ area and compared with that of old MSCs (n = 4). (B) TuD-miR-17/106 repressed miR-17/106 (n = 3). (C) Repression of miR-17/106 induced downregulation of Gdf6 (n = 3). (D) qPCR of Gdf6 and Bmp2/4 in young and old MSCs (n = 8). (E) Administration of recombinant Bmp2 promoted osteogenic differentiation in young but not old MSCs (n = 4). Results are expressed as means ± SEM. NS, p > 0.05; *p < 0.05.