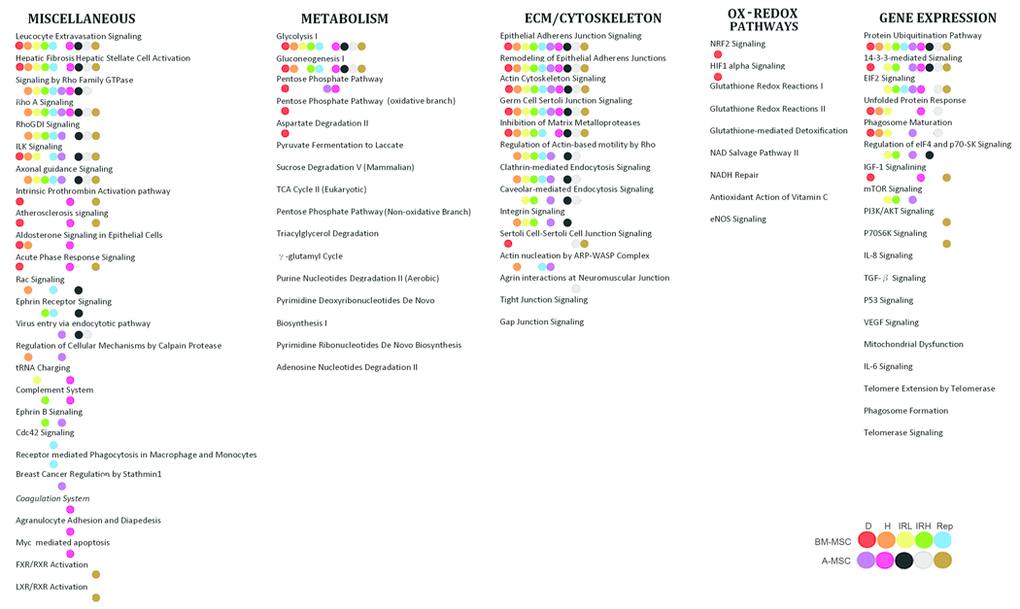
Figure 2.Common canonical pathwaysThe figure shows the pathways common to senescent secretomes. Pathways were grouped according to the classes we identified in the GO analysis. For every experimental condition indicated in the figure with colored dots, IPA analysis allowed the identification of paths that belonged to overlapping networks.